The pitch for eBPF networking usually fits on a conference slide. eBPF is faster than iptables. XDP drops packets at line rate. Cilium replaces kube-proxy, sidecars disappear, and the agents and middleboxes we used to bolt onto every node and every rack can be folded into a few programs running inside the kernel. Every one of those sentences contains something true. Repeated without the machinery underneath, most of them mislead.
I’ve spent a lot of my working life on both sides of this problem. As a former CCNA instructor I used to teach the packet path as a clean sequence of layers, and as a security practitioner I now spend more time asking who is allowed to put code into that path and what happens when it goes wrong. eBPF sits exactly where those concerns meet: networking, the kernel, security and observability all at once. So I wanted to write the article I couldn’t find, one that explains why the technology looks the way it does instead of restating the documentation.
My thesis is simple to state. eBPF changes where in the packet path a decision is made, and that position is the source of nearly all of its real gains. The rest follows from the mechanics. The verifier, which makes running loadable code in the kernel acceptable at all, is both the safety mechanism and the biggest practical constraint, and many elegant ideas simply won’t load. Performance wins are real but depend heavily on the workload and the NIC; “eBPF is faster” is frequently false once you account for map lookups, helpers and the cost of getting the packet to the program in the first place. Debugging and observing eBPF programs themselves is still painful. And the hardest questions are operational: who owns the eBPF layer on a node, how you version, test and roll it, and what happens when it collides with existing kernel modules, hardware offload or the orchestrator.
To get there honestly I have to start at the bottom: a 1993 paper, a register machine, a receive path that runs inside a driver’s poll loop, and a static analyser that recently switched to a different kind of arithmetic. I also ran my own lab, a veth pair between two network namespaces in a privileged Debian 13 container on Docker Desktop’s linuxkit VM (Linux 7.0.14, aarch64), to produce real verifier rejections and real (and, as you will see, humbling) drop rates. All of the code and logs quoted here come from that lab.
Why the old data planes ran out of road
The traditional answers to “filter, balance or observe this traffic” fall into three families. You put rules into netfilter. You put a proxy next to the workload. Or you take the NIC away from the kernel and process packets in userspace. Each one hit a wall that explains a piece of eBPF’s design.
Netfilter’s wall is algorithmic. iptables evaluates rules as a linear chain, and kube-proxy’s iptables mode writes chains whose length grows with the number of Services. The Kubernetes project’s own nftables announcement puts it bluntly: in iptables mode the first packet of a connection costs O(n) in the number of Services. The control plane is worse. iptables-restore rewrites whole tables under a global lock, and the partial syncs added in 1.26 reduced but did not remove O(n) updates. KEP-3866 has section titles I enjoy quoting: “The ipvs mode of kube-proxy will not save us” and “The nf_tables mode of /sbin/iptables will not save us”.
IPVS, the hash-based alternative, did not save anyone either. It met its performance goals and failed as an implementation of Kubernetes Services. The Kubernetes virtual IP documentation credits IPVS mode with faster rule syncing and higher throughput than iptables, then says the kernel IPVS API “turned out to be a bad match for the Kubernetes Services API” and the backend never implemented all of the Service edge cases correctly. IPVS mode has been deprecated since 1.35, and KEP-5495 plans to disable it by default in 1.40 and remove it in 1.43. Those milestones are plans and can slip.
The proxy’s wall is cost and placement. The sidecar model puts an Envoy into every pod and redirects all of the pod’s traffic through it with iptables. That buys isolation per workload and pays for it in memory per pod.
Kernel bypass hits a different wall. DPDK’s poll mode drivers “access Rx and Tx descriptors directly in a polling mode without relying on interrupts (except for Link Status Change notifications)” (DPDK PMD guide). That removes interrupts, system calls, sk_buff allocation and the protocol stack in one stroke, and in its default polling mode it dedicates cores to spinning whether or not traffic is arriving. Cloudflare’s pre-XDP DDoS tool, Floodgate, applied the idea to the largest attacks only. Above 1M packets per second per server, attack traffic moved from iptables to a partial kernel bypass on Solarflare EF_VI that handled more than 5 Mpps on a single core (Gatebot, 2017). It worked, at the price of leaving the kernel’s drivers, routing tables, tooling and security model behind for that traffic.
eBPF’s answer to all three is the same move. Keep the kernel, keep its drivers and its stack, and let a verified program run at the point in the path where the decision is cheapest. To see why that move is possible, and why it is so constrained, we have to go back more than thirty years.
From a 1993 packet filter to an in-kernel execution engine
The BSD Packet Filter paper by McCanne and Jacobson was presented at Winter USENIX in January 1993 (PDF). Its contribution was architectural. The older CMU/Stanford Packet Filter (CSPF) evaluated filters as expression trees on a stack machine. BPF used a register machine with an accumulator, an index register and a small scratch memory, and a control-flow-graph filter model that fitted RISC CPUs and avoided recomputing subexpressions. It also filtered packets in place in the driver’s buffer, so a rejected packet was never copied. The paper is inconsistent about how much faster that was. The abstract says BPF is “up to 20 times faster than the original design” and “up to 100 times faster than Sun’s NIT”, while the introduction says “10 to 150 times faster than Sun’s NIT and 1.5 to 20 times faster than CSPF”. The CSPF ceilings agree; the NIT ceilings, 100 and 150, do not. Quote the range, not one number.
Two ideas from 1993 are still the core of everything in this article. Decide before you copy. And use a restricted instruction set whose safety the kernel can check before running it. XDP is the first idea moved into the driver; the verifier is the second idea taken very, very far.
Linux grew BPF slowly. Jay Schulist added it as Linux Socket Filtering in the 2.1 development series, in patch 2.1.75 of December 1997 (kernel.org), and it shipped in 2.2. LWN dates the socket filter to 2.5; the kernel history does not. Eric Dumazet added an x86-64 JIT in 3.0 (0a14842f5a3c), and seccomp reused BPF in 3.5 (e2cfabdfd075), not in 3.4 as the same LWN article says. The break came in 2014, when Alexei Starovoitov rebuilt the interpreter as “internal BPF” in 3.15 (bd4cf0ed331a): ten 64-bit registers plus a read-only frame pointer, a calling convention deliberately close to x86-64 and arm64, and a 512-byte stack. The commit’s microbenchmark gives about 90 ns for the old interpreter, 31 ns for the new one and 12 ns for the old JIT, on one machine. Classic BPF programs are still accepted from userspace, but the kernel translates them to eBPF (BPF design Q&A).
In 3.18 the bpf() syscall arrived with maps and the verifier (99c55f7d47c0; LWN 603983). From then on the history is a list of new attach points, new verifier capabilities and, later, new lifecycle management. I find it useful to read the list as several threads rather than one timeline.
| Thread | Feature | First release |
|---|---|---|
| Attach points | XDP | v4.8 |
| Attach points | AF_XDP | v4.18 |
| Attach points | XDP multi-buffer | v5.18 |
| Verifier | tnum known-bits tracking | v4.14 |
| Verifier | Spectre v1 hardening for maps | v4.15 |
| Verifier | pointer-arithmetic speculation sanitising | v5.0 |
| Verifier | 1M processed-instruction limit | v5.2 |
| Verifier | bounded loops | v5.3 |
| Verifier | bpf_loop helper | v5.17 |
| Verifier | circular-number (wrapped interval) bounds | v7.2 |
| Verifier | 2 KiB stack for supporting JITs | v7.4-rc1 (pre-release) |
| Types and API | BTF | v4.18 |
| Types and API | kfuncs | v5.13 |
| Lifecycle | bpf_link | v5.7 |
| Lifecycle | XDP link | v5.9 |
| Lifecycle | TCX (fd-based tc attach with links) | v6.6 |
| Security default | unprivileged BPF off by default | v5.16 |
The lifecycle thread arrived last, and that ordering matters later in this article. For years the kernel had a powerful way to put programs into the packet path and no good way to say who owned them.
The JIT deserves a paragraph of its own. An interpreter pays a dispatch branch per instruction. The JIT turns each eBPF instruction into one or a few native instructions, and because the register file and calling convention map onto x86-64 and arm64, a helper call becomes a native call with no argument shuffling. Later the JIT also became a security boundary. Constant blinding came first, in v4.7, as a defence against JIT spraying (4f3446bb809f). Spectre then forced index masking in v4.15 (LWN 743288, b2157399cc98), a retpoline for tail calls in the x86-64 JIT in v4.16 (a493a87f38cf) and pointer-arithmetic sanitising in v5.0 (979d63d50c0c). That is one reason old benchmarks run with retpoline disabled do not transfer to today’s kernels, a point I will come back to with the famous XDP numbers.
There is a hardware branch of this family tree, too. P4 (Bosshart et al., arXiv 1312.1719) came from the switch side, with three stated goals: “reconfigurability in the field”, “protocol independence” and “target independence”. A P4 program defines parsers and match-action tables, and a compiler maps them onto a pipeline. P4 and eBPF share a model: restricted programs, no unbounded loops, state in tables or maps, and a compiler or verifier that guarantees the program fits the target. They differ in what the guarantee says. On some hardware targets, such as a switch ASIC with a fixed pipeline, the P4 compiler has to fit the program into a fixed number of stages, and a program that fits runs at line rate. That is a property of those targets, not of P4, which the paper aims at devices “ranging from relatively slow software switches to the fastest ASIC-based switches”. The eBPF verifier proves memory safety and termination and says nothing about time per packet. The best-known programmable switch ASIC, Barefoot’s Tofino, lost its future when Intel halted development of next-generation Tofino, as the Silicon Valley Business Journal reported in January 2023. Intel’s end-of-life notice (Intel PCN 827577-00) followed on 7 August 2024. eBPF hardware offload, for its part, is narrow: the design Q&A still names only the Netronome NFP driver.
Under the hood: the packet path and its hooks
Figure 1 is the map I keep in my head. The receive-side order inside __netif_receive_skb_core() comes from current net/core/dev.c: generic XDP first, then the ptype_all taps that AF_PACKET and tcpdump use, then tc ingress (where TCX lives), then netfilter’s netdev ingress hook, and only then protocol delivery to ip_rcv() and netfilter PREROUTING. Native XDP runs earlier, inside the driver, before any sk_buff exists.
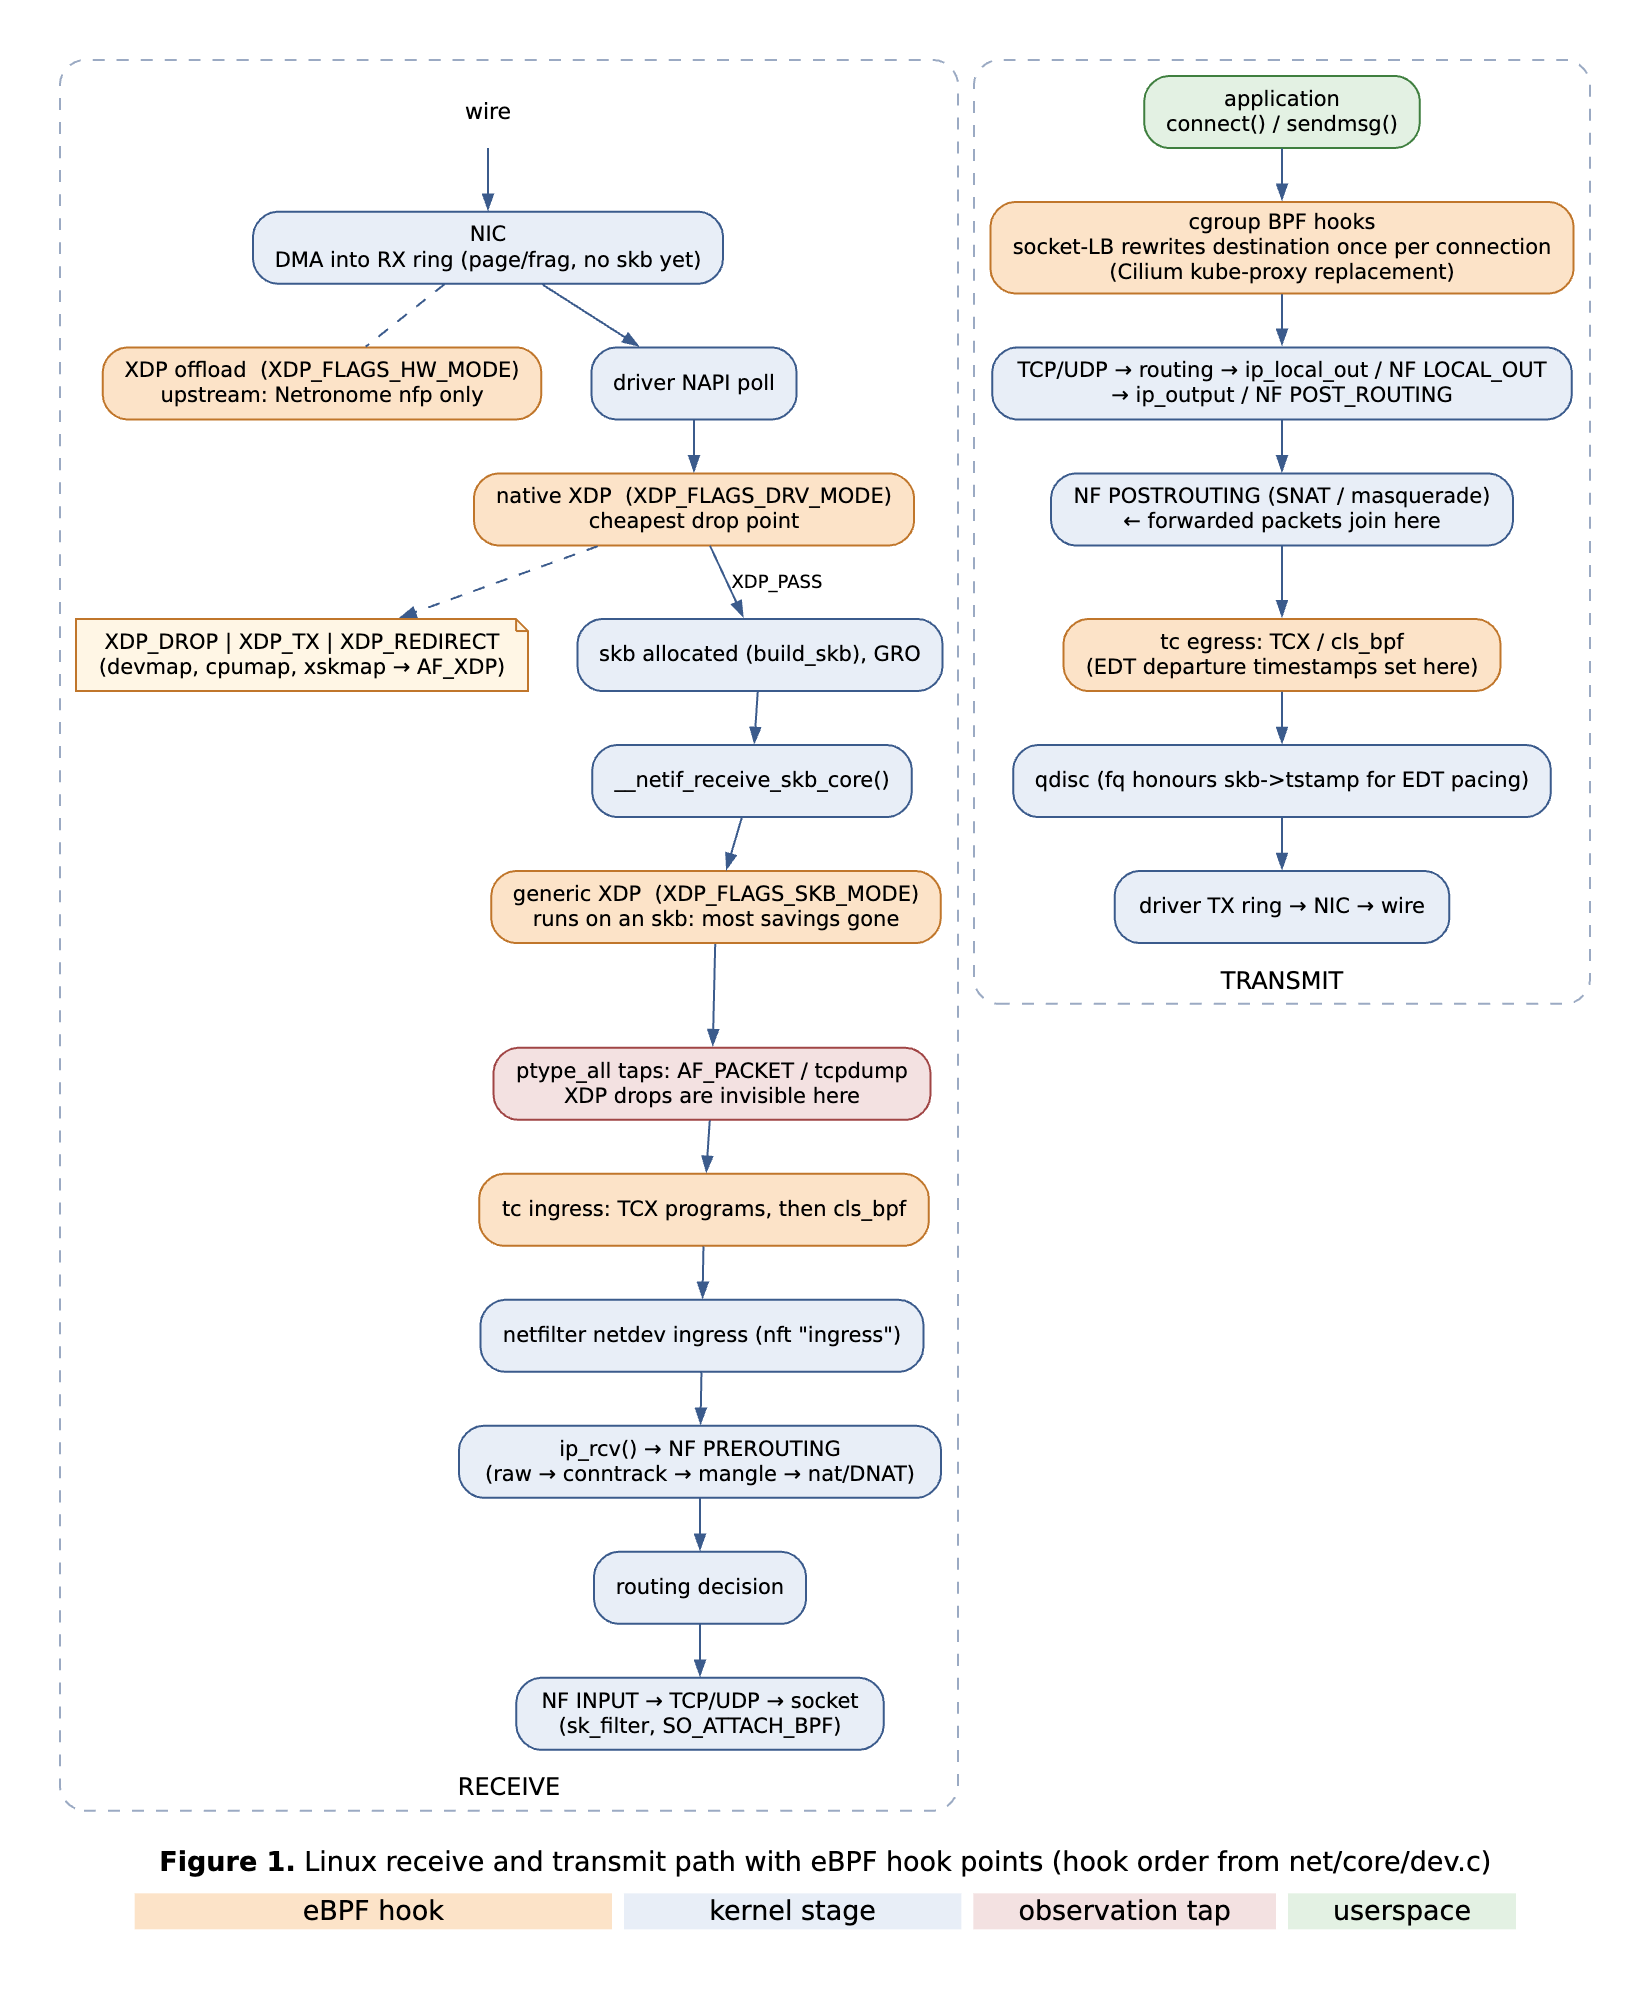
Two consequences of this ordering show up again and again. A packet dropped by XDP never reaches the AF_PACKET taps, so tcpdump on the host will not show it. And Cilium’s socket-level load balancing happens before any packet exists at all, at connect() or sendmsg() time, so pod-to-Service traffic that uses it never needs per-packet DNAT. On the transmit side, Cilium’s bandwidth manager sets earliest-departure timestamps from BPF on tc egress and relies on the fq qdisc to enforce them (Cilium bandwidth manager).
XDP: three modes that behave like three different programs
The XDP modes are flags in the UAPI header (if_link.h): XDP_FLAGS_DRV_MODE (native), XDP_FLAGS_SKB_MODE (generic) and XDP_FLAGS_HW_MODE (offload), plus XDP_FLAGS_UPDATE_IF_NOEXIST and XDP_FLAGS_REPLACE for safe replacement.
Native mode runs in the driver’s NAPI poll loop right after the DMA’d frame is available. The program can drop the packet, transmit it back out of the same NIC, redirect it to another NIC, another CPU or an AF_XDP socket, or pass it to the normal stack (XDP paper). Generic mode works on any device because it runs after the skb is built; bpftool’s documentation describes it as running “when packet already enters receive path as skb” (bpftool-net). Most of what makes XDP cheap is already gone at that point. Offload runs the program on the NIC and, upstream, means Netronome.
XDP originally assumed one packet per page, which ruled out jumbo frames and LRO. Multi-buffer support landed in 5.18: the core series shipped with mvneta support, and veth gained it in the same release (kernelnewbies 5.18). mlx5e got it in 5.18 only for its legacy receive queue (ea5d49bdae8b), and the striding receive queue it uses by default followed in 6.4 (f52ac7028bec). Driver coverage keeps growing, and you have to check it per driver and per kernel.
Here is the XDP program I used in my lab. It parses Ethernet, IPv4 and UDP, counts drops per CPU and drops UDP to port 9. Every header access is preceded by a comparison against data_end. That comparison is the program’s half of a contract with the verifier.
struct {
    __uint(type, BPF_MAP_TYPE_PERCPU_ARRAY);
    __uint(max_entries, 2);
    __type(key, __u32);
    __type(value, __u64);
} drop_cnt SEC(".maps");

static __always_inline int is_target(void *data, void *data_end)
{
    struct ethhdr *eth = data;
    if ((void *)(eth + 1) > data_end) return 0;
    if (eth->h_proto != bpf_htons(ETH_P_IP)) return 0;
    struct iphdr *ip = (void *)(eth + 1);
    if ((void *)(ip + 1) > data_end) return 0;
    if (ip->protocol != IPPROTO_UDP || ip->ihl != 5) return 0;
    struct udphdr *udp = (void *)(ip + 1);
    if ((void *)(udp + 1) > data_end) return 0;
    return udp->dest == bpf_htons(9);
}

SEC("xdp")
int xdp_drop_udp9(struct xdp_md *ctx)
{
    void *data = (void *)(long)ctx->data;
    void *data_end = (void *)(long)ctx->data_end;
    if (!is_target(data, data_end))
        return XDP_PASS;
    __u32 k = 0;
    __u64 *v = bpf_map_lookup_elem(&drop_cnt, &k);
    if (v) *v += 1;
    k = 1;
    v = bpf_map_lookup_elem(&drop_cnt, &k);
    if (v) *v += bpf_xdp_get_buff_len(ctx);
    return XDP_DROP;
}
AF_XDP: packets to userspace without giving up the NIC
AF_XDP is the kernel’s reply to people who still want packets in userspace (AF_XDP docs). A UMEM is a userspace memory area registered with XDP_UMEM_REG and split into equal frames. It has a FILL ring that hands empty frames to the kernel and a COMPLETION ring that returns transmitted frames. Each socket adds an RX and a TX ring whose descriptors point into the UMEM. An XDP program decides which packets go to which socket by redirecting into a BPF_MAP_TYPE_XSKMAP. All four rings are single-producer, single-consumer rings in shared memory. With XDP_USE_NEED_WAKEUP the kernel sets a flag when userspace has to make a syscall to wake it up, so a busy application can skip the syscall whenever the flag is clear; whether an idle one blocks in poll() or keeps spinning is the application’s choice. The difference from DPDK is that the driver stays in the kernel and only the selected flows are diverted, so the rest of the host keeps using the normal stack. The XDP paper mentions “upwards of 20 Mpps” to userspace on one core, but as preliminary zero-copy numbers in its future-work section, not as one of its measurements. AF_XDP itself landed in 4.18, and the first upstream zero-copy drivers, i40e (0a714186d3c0) and ixgbe (8221c5eba8c1), arrived in 4.20.
Maps, helpers, kfuncs and tail calls
Maps are the main way a program keeps structured state between invocations and shares data with userspace; ring and perf buffers and trace output are the other channels. Per-CPU hash and array maps give each CPU its own copy of a value, so updates need no atomics and no cache-line bouncing; Katran’s per-CPU, lockless structures are why it reports linear scaling with RX queues (Meta). LRU hash maps evict on insert instead of failing when full, which makes them the natural connection table. The LPM trie is “an unbalanced trie of nodes that uses prefixlen,data pairs as its keys” (LPM trie docs), so lookup cost grows with prefix length, unlike the hardware TCAMs it replaces. Anyone who has designed ACLs for a switch should pause on that sentence. The BPF ring buffer (5.8) is a multi-producer, single-consumer buffer shared by all CPUs that fixes the wasted memory and the lost cross-CPU ordering of the older per-CPU perf buffer (ring buffer docs).
Helpers are the original kernel interface: a numbered list of functions with stable UAPI semantics such as bpf_map_lookup_elem, bpf_redirect_map and bpf_fib_lookup. The kernel now prefers kfuncs. The design Q&A says “New BPF functionality is generally added through the use of kfuncs instead of new helpers” and that kfuncs “are not considered part of the stable API”. The kfunc documentation compares them to EXPORT_SYMBOL_GPL. For an operator this is a quiet but significant shift: features delivered as kfuncs can change between kernels, and the compatibility burden moves into your CI.
A tail call (bpf_tail_call) jumps into another program from a PROG_ARRAY, never returns and reuses the current stack frame. It is how large data planes such as Cilium split work across programs and swap them at run time, and the chain is capped at MAX_TAIL_CALL_CNT = 33. BPF-to-BPF calls are ordinary calls with their own frames. Mixing the two is restricted, and on x86-64 in v6.6 the verifier refuses a tail call when the frames above it already use 256 bytes or more, because a tail call unwinds its own frame but not its callers’.
Finally, BTF and CO-RE solve portability. The kernel exposes its own type information at /sys/kernel/btf/vmlinux, clang records a field access as a relocation by name and type (a pid field of type pid_t within struct task_struct) instead of a fixed offset, and libbpf patches the offsets against the running kernel at load time (Nakryiko, BPF CO-RE). Pure packet programs that only touch packet bytes and UAPI structs need CO-RE less. It pays off most for precompiled observability programs that read sk_buff, sock or task_struct internals and have to run on many kernels, although compiling on the target against its own headers, as classic BCC does, also works.
The verifier: the safety mechanism and the wall
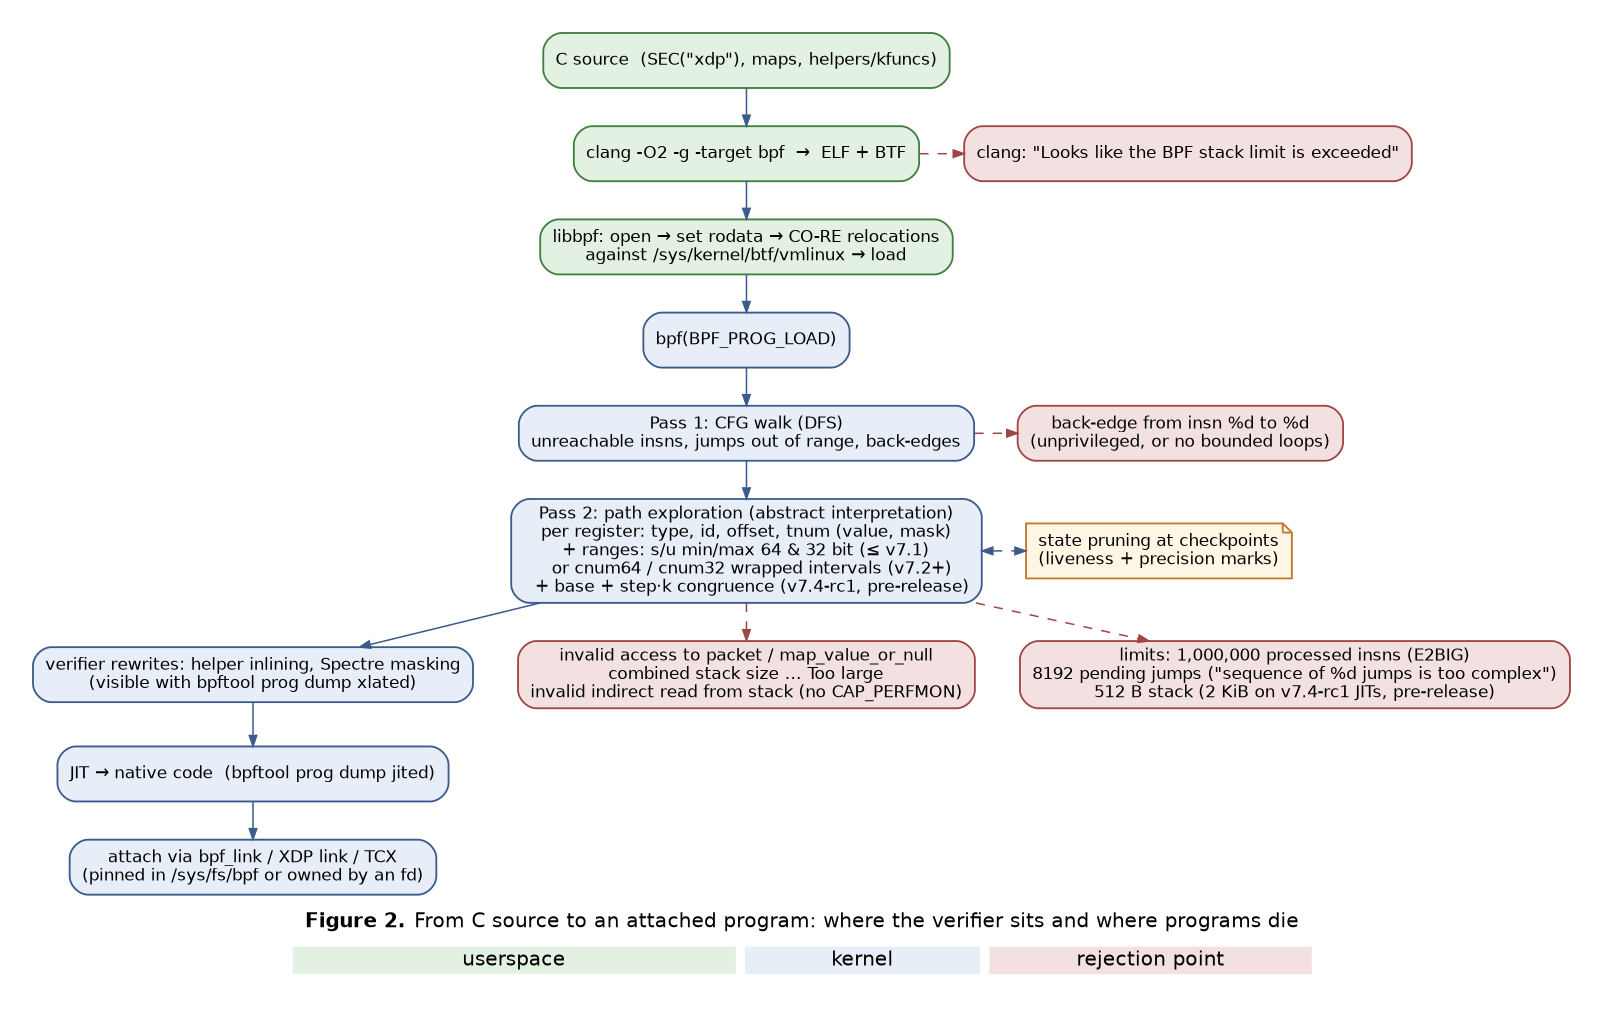
Everything above is only acceptable because of one component. Before the kernel runs a program, the verifier has to prove that it terminates, touches only memory it is allowed to touch, leaks no kernel pointers to unprivileged users and releases every reference it takes. It does this by abstract interpretation over register and stack state, with heuristics that keep the work bounded. It is sound by intent, incomplete by design, and it has had soundness bugs in practice. That combination is my first central point: the verifier is both the safety mechanism and the biggest practical constraint on what you can build. The design Q&A puts the consequence in one sentence that every eBPF developer eventually learns by heart: “The only way to know that the program is going to be accepted by the verifier is to try to load it.”
Two passes
The verifier documentation describes two steps. The first is a depth-first walk of the control-flow graph. Historically it was a “DAG check to disallow loops”; it still rejects unreachable instructions and jumps out of range. Since bounded loops arrived in v5.3, a back-edge is no longer automatically fatal for a privileged loader, and in v6.6 the CFG pass rejects it only when the loop is not allowed or the loader lacks bpf_capable.
The second step “starts from the first insn and descends all possible paths. It simulates execution of every insn and observes the state change of registers and stack”. At entry R1 is PTR_TO_CTX. After a helper call R1 to R5 are scratched and R6 to R9 are preserved. Stack accesses must stay within the frame relative to R10, and for a loader without CAP_PERFMON they may be read only after they have been written (demo 06 below shows the exception). At every conditional jump the verifier pushes one branch onto a work stack, refines register ranges on each side (on the true side of if r1 < 10, the unsigned maximum of r1 becomes 9) and keeps going. That is path-sensitive analysis, and its cost is exponential in the number of independent branches unless pruning merges paths.
What the verifier knows about a register
Each register carries a type (scalar, PTR_TO_CTX, PTR_TO_PACKET, PTR_TO_PACKET_END, PTR_TO_MAP_VALUE, PTR_TO_MAP_VALUE_OR_NULL, PTR_TO_STACK, socket and BTF pointers), a fixed offset, an id that links copies of the same pointer, and a description of its possible numeric values.
From v5.7, when explicit 32-bit bounds tracking arrived (3f50f132d840), until v7.1, the numeric description was five abstract domains run side by side: a tnum (known bits), plus signed and unsigned 64-bit bounds, plus signed and unsigned 32-bit bounds. Before v5.7 there were three, the tnum and the two 64-bit bounds. In v6.6 these are var_off, smin_value/smax_value, umin_value/umax_value and their 32-bit equivalents. After each operation reg_bounds_sync() lets the domains tighten each other. The authors of Agni (CAV 2023) describe this as a non-modular composition through “reduction operators” for which the kernel gave no soundness guarantees. Unsurprisingly, it attracted bugs.
The tnum is worth understanding at the bit level, because it explains both how bounds checks are proved and why the verifier needs more than one domain. Edward Cree introduced it in v4.14 (f1174f77b50c). A tnum is a pair (value, mask). A 1 bit in mask is unknown; a 0 bit in mask is known and equals the matching bit of value. So (0b0100, 0b0011) is 01xx, the set {4, 5, 6, 7}. Addition in kernel/bpf/tnum.c looks like this:
struct tnum tnum_add(struct tnum a, struct tnum b)
{
    u64 sm, sv, sigma, chi, mu;

    sm = a.mask + b.mask;
    sv = a.value + b.value;
    sigma = sm + sv;
    chi = sigma ^ sv;
    mu = chi | a.mask | b.mask;
    return TNUM(sv & ~mu, mu);
}
sv is the sum when every unknown bit is 0, and sigma is the sum when every unknown bit is 1. Any bit where those two extreme sums differ may have been touched by a carry, so it becomes unknown. Work it through for a = 000001xx (value 4, mask 3, the set {4..7}) plus the constant 1:
sm     = 3 + 0           = 0b0011
sv     = 4 + 1           = 0b0101
sigma  = 3 + 5           = 0b1000
chi    = 0b1000 ^ 0b0101 = 0b1101
mu     = 0b1101 | 0b0011 = 0b1111
result = (0b0101 & ~0b1111, 0b1111) = 0000xxxx   ->  {0..15}
The true answer is {5, 6, 7, 8}. The tnum result is sound, since it contains every real result, and it is also the best a tnum can do: 7 is 0111 and 8 is 1000, so all four low bits vary and only 0000xxxx covers both. The looseness belongs to the domain, not to a sloppy algorithm. That is exactly why the verifier keeps interval domains next to the tnum: the interval [4,7] + 1 = [5,8] is exact, and the sync step keeps the tighter of the two.
AND goes the other way, and it is how most bounds checks are actually proved. tnum_and computes v = a.value & b.value and returns (v, (a.value|a.mask) & (b.value|b.mask) & ~v). Take a = xxx10xx0 (value 0x10, mask 0xE6) and the constant 0x0F. The result is 00000xx0, the set {0, 2, 4, 6}. Code that writes idx &= 0x0f before indexing an array gives the verifier a hard upper bound from bit arithmetic alone, even if it knew nothing about the high bits. Going from a range to a tnum over-approximates in turn: tnum_range(5, 6) becomes 000001xx, so two values become four. Vishwanathan, Shachnai, Narayana and Nagarakatte later proved the kernel’s tnum addition and subtraction sound and optimal and contributed a faster multiplication that the kernel adopted (arXiv 2105.05398).
The 2026 change most articles have not caught up with
Almost everything written about verifier internals still describes smin, smax, umin and umax. That design is gone from current kernels. In 2026 Eduard Zingerman added “circular numbers”, wrapped intervals (256f0071f9b6), and then replaced the four min/max pairs with them (bbc631085503); both commits are first contained in v7.2. A cnum32 or cnum64 is an arc on the 2^32 or 2^64 circle given by a base and a size, which represents a signed and an unsigned range as one object (cnum.h, v7.3). The introducing commit says the operations’ correctness “is verified using cbmc model checker” and cites wrapped-interval work on machine arithmetic. In v7.2 and v7.3, bpf_reg_state has struct cnum64 r64 and struct cnum32 r32 and no smin_value field (bpf_verifier.h, v7.3). The v7.4-rc1 tree goes one step further and adds a congruence component, under which “the value … lies on a line described by a linear equation base + step * k” (v7.4-rc1 bpf_verifier.h). The base + step part is pre-release as I write this, and no published analysis yet confirms the soundness gains of either change.
Why does this matter beyond trivia? Look at where the verifier’s worst bugs were.
| CVE | What went wrong | CVSS 3.x |
|---|---|---|
| CVE-2020-8835 | 32-bit register bounds not properly restricted, OOB read/write | 7.8 |
| CVE-2021-3490 | ALU32 AND/OR/XOR did not update 32-bit bounds | 7.8 |
| CVE-2021-31440 | wrong propagation of 32-bit unsigned bounds from 64-bit bounds | 7.0 (NVD), 8.8 (ZDI) |
| CVE-2022-23222 | pointer arithmetic allowed on some *_OR_NULL pointer types | 7.8 |
| CVE-2023-2163 | incorrect pruning from missing precision marks; arbitrary read/write, container escape | 10.0 (Google CNA), 8.8 (NVD) |
Three of the five sit in the range-tracking machinery, one in pointer-type checking (arithmetic on *_OR_NULL pointers, CVE-2022-23222) and one in pruning (CVE-2023-2163). Formal methods attacked the same area from several directions. PREVAIL (PLDI 2019) rebuilt verification on abstract interpretation with the relational Zone domain, criticised the Linux verifier’s “high rate of false positives, poor scalability, and lack of support for loops”, and was the first to verify the safety of eBPF programs with loops, although its prototype did not check that they terminate; eBPF for Windows uses it. Agni automatically checked the kernel’s range analysis across 16 kernel versions from 4.14 to 5.19, found “27 previously unknown bugs, which have been subsequently fixed by unrelated patches”, and proved the analysis sound for 5.19. The cnum work model-checked its operators before merging. So if you are reading a verifier explainer that talks about four min/max pairs, it describes kernels up to v7.1. That is still most production fleets. It is no longer the design.
Pruning, precision and the budgets
Without pruning, a program with 30 independent if statements has up to 2^30 paths. At certain instructions the verifier stores checkpoints of states it has already proved safe, and when it arrives at the same instruction again, “if any of them contain the current state as a subset, the branch is ‘pruned’”. Two refinements make pruning effective and dangerous at once. Liveness lets the comparison ignore registers that are never read again. Precision tracking treats scalars as imprecise by default and, when one is used in something safety-relevant such as a pointer offset or a helper size, walks backwards and marks every scalar that contributed to it as precise. Only precise scalars are compared by value, and even they do not have to match exactly: the current state’s range and known bits only have to fit inside the stored state’s (range_within and tnum_in). Miss a precision mark, and two states that differ in a safety-relevant value are treated as equivalent and the unsafe path is never checked. That is CVE-2023-2163, fixed by “bpf: Fix incorrect verifier pruning due to missing register precision taints” (71b547f56124).
The budgets are what you will actually run into. BPF_COMPLEXITY_LIMIT_INSNS counts instructions processed by the analysis, not instructions in the program. It was 131072 before v5.2, when c04c0d2b968a raised it to 1,000,000, with the rationale that “On typical x86 machine non-debug kernel processes 1M instructions in 1/10 of a second”. That commit also describes what people had been doing under the old limits: load-and-retry loops that shrink a MAX_FOO constant until the program fits, and splitting programs across tail calls. Unprivileged programs are still limited to 4096 instructions in size. Pending jumps are capped at 8192 (BPF_COMPLEXITY_LIMIT_JMP_SEQ), and exceeding that rejects the program, as demo 02 below shows. BPF_COMPLEXITY_LIMIT_STATES (64) is not a rejection cap: on 6.12 it only stops the verifier from storing more checkpoints per instruction for loaders without bpf_capable, and on v7.4-rc1 the macro is no longer used as a limit. The stack has been 512 bytes since 2014, summed over each BPF-to-BPF call chain. In September 2026, commits 9f3bcf081ded and 9cfc28c9a8e6 introduced MAX_BPF_STACK_JIT = 2048 for JITs that report large-stack support, which the design Q&A lists as x86-64 and arm64. That change is in v7.4-rc1 and not in v7.3, so no released kernel had it on the day I wrote this. Even there, interpreted programs and programs that call bpf_clone_redirect() keep 512 bytes.
Loops are where the budgets bite hardest. Bounded-loop support in v5.3 (2589726d12a1) does no induction-variable analysis. The verifier simply keeps simulating the loop body, and the loop is accepted if every path reaches an exit within budget. A loop with a 10,000-iteration bound can therefore multiply the body’s cost in processed instructions by up to 10,000, less whatever pruning saves. LWN records that earlier proposals with real loop analysis were not merged. bpf_loop() (v5.17) sidesteps the problem by calling a callback up to BPF_MAX_LOOPS times. Through v6.6 the verifier checked the callback once; since v6.7 (ab5cfac139ab) it explores the callback again until its state converges, which is what my 7.0 lab kernel does.
What the verifier did with the demos
Theory is cheap. I wrote small XDP programs in a bad and a fixed version, compiled them with clang -O2 -g -target bpf (clang 19.1.7) and loaded them on 7.0.14 with bpftool -d prog load, which makes libbpf print the full verifier log. Every verifier error below is copied from those logs. The x03b line is clang 19.1.7’s own diagnostic.
| Demo | Verifier (or compiler) output for the bad version | Fix that loaded |
|---|---|---|
| 01 packet read without bounds check | invalid access to packet, off=12 size=1, R1(id=0,off=12,r=0) / R1 offset is outside of the packet | compare eth + 1 with data_end |
| 02 loop bounded only by packet end | The sequence of 8193 jumps is too complex. (after 114,776 processed insns) | constant bound MAX_SCAN = 256 |
| 03 320 + 320 bytes of stack over two frames | combined stack size of 2 calls is 640. Too large | per-CPU array as scratch |
| 04 map value used without NULL check | loaded: a 1-slot array lookup of key 0 came back as R0=map_value, never null | if (!cnt) return |
| 05 packet byte (0..255) as index into a 64-byte value | invalid access to map value, value_size=64 off=255 size=1 / R1 max value is outside of the allowed memory range | if (idx >= 64) return |
| 06 uninitialised key padding | loaded as root; without CAP_PERFMON: invalid read from stack R2 off -16+13 size 16 | memset the key |
| x03b one 600-byte local array | clang: Looks like the BPF stack limit is exceeded | n/a |
Demo 01 is the textbook case, and its log is a good place to learn to read verifier output. The r=0 is the proven-safe range of the packet pointer, which is zero because nothing has been compared with data_end:
0: R1=ctx() R10=fp0
; void *data = (void *)(long)ctx->data; @ 01_no_bounds_check_bad.c:6
0: (61) r1 = *(u32 *)(r1 +0)          ; R1_w=pkt(r=0)
; if (eth->h_proto == bpf_htons(ETH_P_IP))   /* no check against data_end */
1: (71) r2 = *(u8 *)(r1 +12)
invalid access to packet, off=12 size=1, R1(id=0,off=12,r=0)
R1 offset is outside of the packet
processed 2 insns (limit 1000000) max_states_per_insn 0 total_states 0 peak_states 0 mark_read 0
Demo 02 surprised me, and I like it best because it shows what “many elegant ideas simply won’t load” means in practice. The program walks the packet byte by byte from the start of the Ethernet frame until it finds a zero or runs out of packet. Every single access is bounds-checked. It is safe. It does not load.
SEC("xdp")
int xdp_prog(struct xdp_md *ctx)
{
    void *data_end = (void *)(long)ctx->data_end;
    unsigned char *p = (void *)(long)ctx->data;
    __u32 n = 0;
    while (1) {
        if ((void *)(p + 1) > data_end)
            break;
        if (*p == 0)
            break;
        p++;
        n++;
    }
    return n > 100 ? XDP_DROP : XDP_PASS;
}
I expected this to fail on the 1M processed-instruction budget with -E2BIG. It failed on something else, much earlier:
14: R1=8191 R4=pkt(off=8191,r=8191)
14: (07) r4 += 1                      ; R4=pkt(off=8192,r=8191)
15: (3d) if r2 >= r4 goto pc-9
The sequence of 8193 jumps is too complex.
verification time 1580629 usec
stack depth 0
processed 114776 insns (limit 1000000) max_states_per_insn 4 total_states 8390 peak_states 209 mark_read 0
-- END PROG LOAD LOG --
libbpf: prog 'xdp_prog': failed to load: -7
The packet pointer advances by one each iteration, so no two loop-head states are equal and nothing prunes. The stack of pending branch states grew past BPF_COMPLEXITY_LIMIT_JMP_SEQ (8192) at 114,776 processed instructions, well below the 1M budget. Verification took 1.58 s of kernel time; the whole bpftool -d prog load took 72.81 s of wall time, but that was a debug load. The wall time includes producing the full verifier log, and libbpf may retry a load with a bigger log buffer when the kernel returns ENOSPC. Even 1.58 s for one rejection is an operational cost when CI loads dozens of objects. The fix is to give the verifier a bound it can see, for (int i = 0; i < MAX_SCAN; i++) with MAX_SCAN = 256, and that is also a policy decision: the program now silently stops scanning after 256 bytes. Whether E2BIG or the jump-sequence limit triggers first depends on the loop’s shape, and I tested only this one shape.
Demo 03 shows the two different places a stack problem can surface. A single 600-byte local array never reaches the kernel, because clang refuses to compile it:
error: Looks like the BPF stack limit is exceeded. Please move large on stack variables into BPF per-cpu array map. For non-kernel uses, the stack can be increased using -mllvm -bpf-stack-size.Split the same pressure into two 320-byte buffers, one in the program and one in a noinline callee, and clang is happy, because each frame is under 512 bytes. The verifier adds the frames up and reports combined stack size of 2 calls is 640. Too large with stack depth 320+320. On a v7.4 kernel with a supporting JIT the same program may load, and that is a brand-new portability trap: a program tested on 7.4 can fail on 7.3.
Demo 04 is the other kernel-dependent surprise. The source does bpf_map_lookup_elem on a one-slot array with key 0 and increments through the pointer with no NULL check. On this 7.0.14 kernel the verifier refined the helper return to R0=map_value(map=pkts,ks=4,vs=8) and loaded the program. The NULL check in the fixed version is still the right habit; this kernel just happened to prove the pointer was never null.
Demo 06 is the one that did not fail as root, and it taught me more than the others. The program builds a 16-byte flow key on the stack (13 bytes of fields and 3 bytes of padding) without zeroing it and passes it to bpf_map_lookup_elem:
struct flow { __u32 saddr; __u32 daddr; __u16 sport; __u16 dport; __u8 proto; };  /* 13 bytes + 3 pad */
...
    struct flow f;                       /* not zeroed: 3 padding bytes stay uninitialised */
    f.saddr = ip->saddr; f.daddr = ip->daddr; f.sport = 0; f.dport = 0; f.proto = ip->protocol;
    __u64 *v = bpf_map_lookup_elem(&flows, &f);
The verifier state right before the call shows exactly what you would fear, fp-8=???mmmmm, where each ? is an uninitialised byte. As full root, it loaded. It was rejected only after I removed CAP_PERFMON and CAP_SYS_ADMIN with setpriv --inh-caps=-all --bounding-set=-perfmon,-sys_admin, which kept every other root capability, CAP_BPF and CAP_NET_ADMIN included:
invalid read from stack R2 off -16+13 size 16Offset -16+13 is byte 13 of the key, the first padding byte. This matches master source, where env->allow_uninit_stack comes from bpf_allow_uninit_stack(), which returns bpf_token_capable(token, CAP_PERFMON). The lesson is uncomfortable: “it loaded on my machine as root” proves less than it seems, because a loader without CAP_PERFMON and CAP_SYS_ADMIN gets a stricter verifier. Zero hash keys with memset regardless, since random padding also makes lookups miss at random. Two smaller details from the same run: without CAP_PERFMON the log prints map addresses as r1 = 0x0, and my first attempt to drop capabilities with capsh --drop=... silently failed because the inheritable set restored them on exec. I only caught it because I logged CapEff.
Who the verifier protects now
Even a perfectly sound verifier does not reason about speculative execution, which is why array-map indices have been masked after bounds checks since v4.15 (b2157399cc98) and pointer arithmetic has been sanitised since v5.0. The kernel.unprivileged_bpf_disabled sysctl has three values (sysctl docs): 0 allows unprivileged bpf(), 1 disables it for good on the running kernel, and 2 disables it but lets the admin switch back. Pawan Gupta’s “bpf: Disallow unprivileged bpf by default” made BPF_UNPRIV_DEFAULT_OFF default to y in v5.16 (8a03e56b253e), to “Sync with what many distros are currently applying already”, and the Kconfig help cites “speculative execution side-channel vulnerabilities”. Android was the historical exception, because netd on Android R and S depended on unprivileged BPF (LKML). My lab kernel ran with unprivileged_bpf_disabled=0.
So the threat model has shifted. In 2026 the verifier mainly protects the kernel against bugs in privileged tooling and against a holder of CAP_BPF escalating to full kernel control. On default kernels it is no longer a sandbox for arbitrary local users. From a security engineering point of view, that tells you what CAP_BPF really is: a capability you grant to a component you trust almost as much as the kernel.
Performance, honestly
My second central point is that the performance wins are real but depend on the workload and the NIC far more than the slogans admit. Every claim in this area comes down to nanoseconds per packet, so start with arithmetic.
A minimum Ethernet frame is 64 bytes, and on the wire it also carries 8 bytes of preamble and start delimiter plus a 12-byte inter-frame gap: 84 bytes, or 672 bits. At 10 Gbit/s that is 10^10 / 672 ≈ 14.88 Mpps, or 67.2 ns per packet. At 100 Gbit/s it is about 148.8 Mpps, or 6.72 ns per packet, which is roughly 20 cycles on a 3 GHz core. A single last-level cache miss costs more than that. No software path handles 100G at minimum frame size on one core. The real questions are how many cores it takes and what you spend per packet.
What the XDP paper actually measured
The reference numbers come from Høiland-Jørgensen et al., “The eXpress Data Path”, CoNEXT 2018 (paper, artifacts). The testbed was an Intel Xeon E5-1650 v4 at 3.60 GHz with Mellanox ConnectX-5 Ex 100 Gbps adapters on a pre-release of Linux 4.18.
| Test | XDP | DPDK | Linux stack |
|---|---|---|---|
| Drop, single core | 24 Mpps | 43.5 Mpps | 4.8 Mpps (iptables raw), 1.8 Mpps (with conntrack) |
| Per-packet time, drop | 41.6 ns | 22.9 ns | |
| Mean forwarding latency at 100 pps | 82 µs | 2 µs | |
| Mean forwarding latency at 1 Mpps | 7 µs | 3 µs |
The paper explains the drop gap with refreshing precision. The 18.7 ns difference is about 67 cycles at 3.6 GHz. Each function call costs about 1.3 ns, the mlx5 driver path made about 10 calls per packet, and removing 4 of them raised XDP to 29 Mpps. The authors extrapolated a ceiling of 37.6 Mpps, which is a projection and not a measurement. The low-rate latency gap is interrupts: DPDK busy-polls and forwards in 2 µs, XDP pays for interrupts and NAPI scheduling at low load, and DPDK burns a whole core at 100% to get its number.
Then read the detail that most quotations drop. The authors disabled full preemption and the retpoline mitigation for their tests, so the table says nothing about XDP’s cost with Spectre mitigations on. Since v5.6 the BPF dispatcher (75ccbef6369e, 7e6897f95935) turns the driver’s indirect call into the XDP program into a direct call to avoid the retpoline, and Cloudflare’s 10.1 Mpps XDP figure below was measured with full generic retpoline. “eBPF beats DPDK” is false on raw single-core throughput. “eBPF beats iptables” is true for early drop, and the paper’s macro results are kinder still: software routing with a full table of 752,138 routes ran 2.5 times faster than the regular stack, and in the DoS test a server protected by an XDP filter held about 28,500 TCP transactions per second up to 19.5 Mpps of attack traffic, while the unprotected server’s throughput halved at 3 Mpps and reached zero around 3.5 Mpps.
Where “eBPF is faster” is false
Generic mode is the first trap. It runs after the kernel has already allocated an sk_buff, so most of the saving is gone, and on virtual NICs without native support an “XDP” deployment can be slower than a well-tuned tc program. Cilium’s NodePort XDP acceleration needs native XDP and does not fall back to generic mode, so its kube-proxy replacement guide says the feature is not supported on GCP, where both Compute Engine virtual NICs lacked native XDP (Cilium kube-proxy replacement). That note is stale against Cilium’s own driver table, which now lists gve from kernel 6.4 and virtio_net from 4.10 (Cilium XDP drivers).
Offload to a weak NIC CPU is the second. Hohlfeld et al. (IEEE NetSoft 2019) measured a Netronome Agilio CX on kernel 4.18 and found that with only 6 checksum computations per packet, offload was slower than XDP in the driver on 4 host cores. They warn that “offloading to hardware can yield detrimental performance”, and updating a 26 MiB map on the NIC took “more than 40 seconds”. That is one 10G NIC on 2019 software, so I would not generalise it to all SmartNICs.
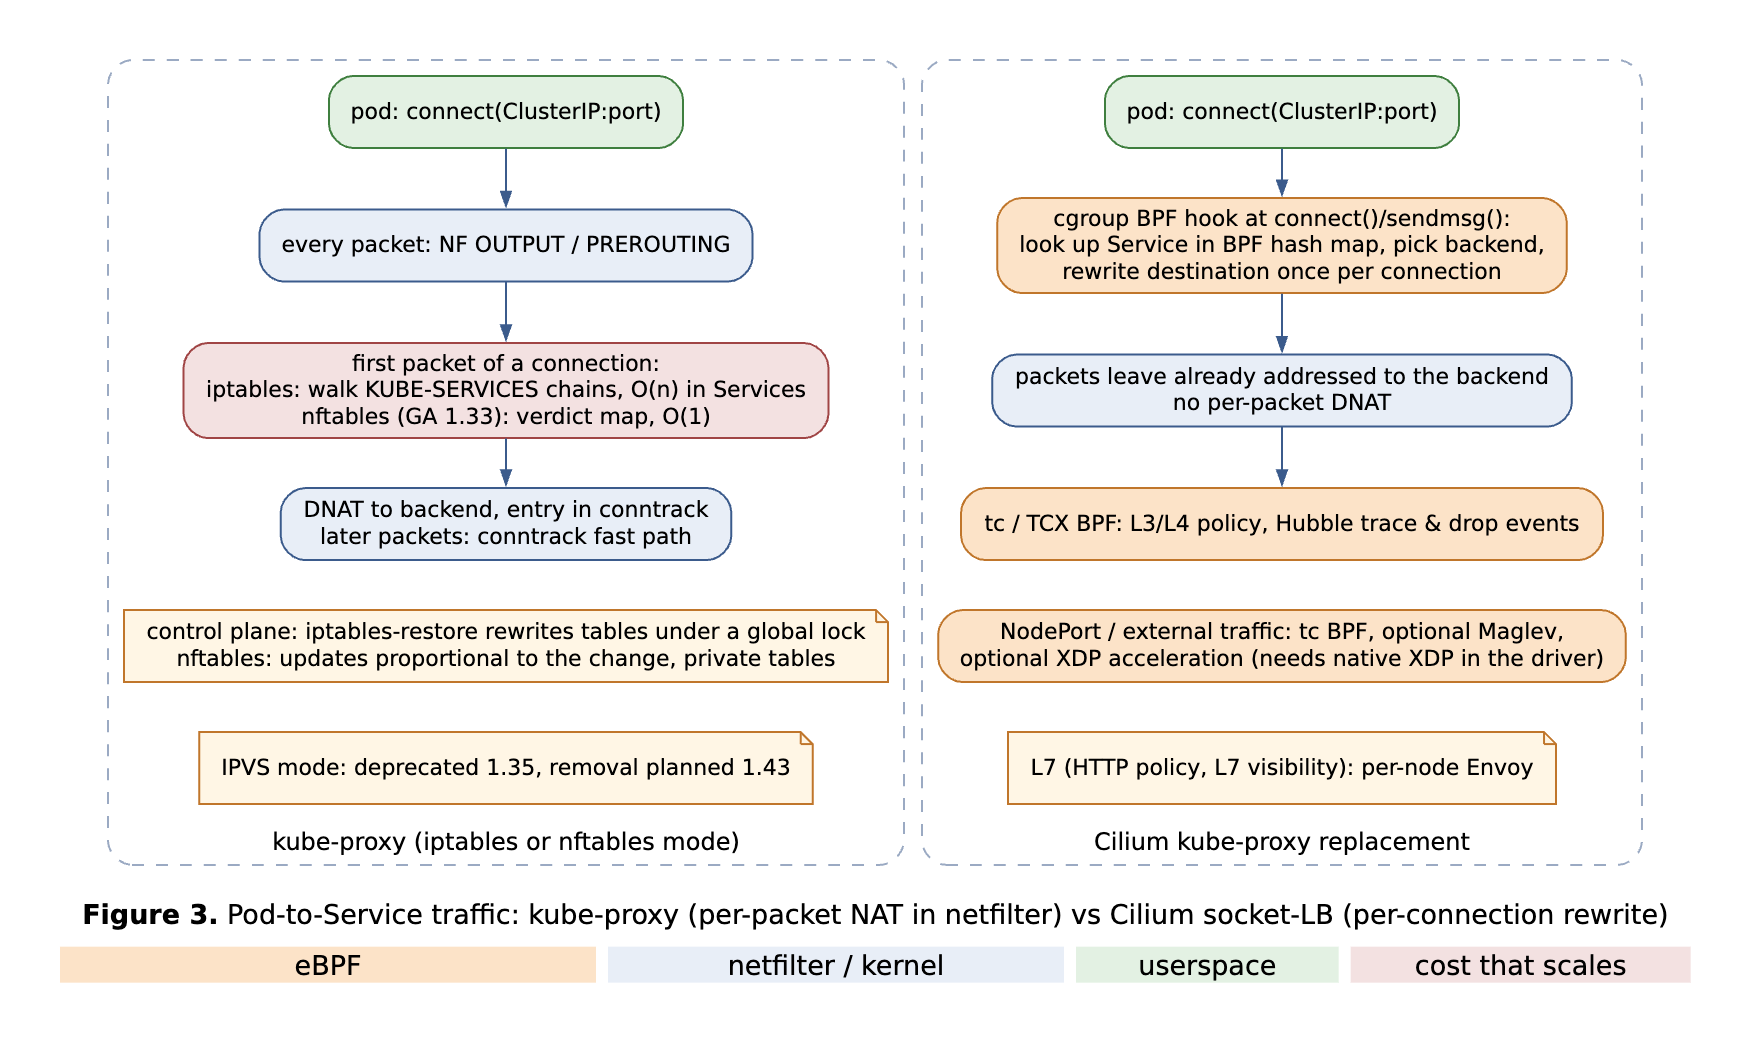
Established flows are the third, and the one most Kubernetes comparisons get wrong. The linear cost of iptables Services hits the first packet of a connection; after that, conntrack handles the flow. Cilium’s own benchmark page, which measures pod-to-pod traffic and not the kube-proxy Service path, says iptables “is optimized to perform most of the required work per connection and then caches the result”. A long-lived gRPC connection gains little from replacing kube-proxy. A connection-churn workload gains a lot.
And the baseline moved. kube-proxy’s nftables mode was alpha in 1.29, beta in 1.31 and GA in 1.33, and it requires kernel 5.13 or later. It uses a verdict map for O(1) dispatch, and its updates are proportional to what changed. Each component that uses nftables gets its own private table, so, as the Kubernetes nftables announcement puts it, there is “no global lock contention between components like with iptables”. The same post reproduces latency numbers that Nadia Pinaeva (Red Hat) and Antonio Ojea (Google) presented at KubeCon North America 2024 (talk): at 5,000 and 10,000 Services the nftables p50 was about the iptables p01, and at 30,000 Services the nftables p99 beat the iptables p01 by a few microseconds. iptables remains the default “for compatibility reasons” in 1.37, and KEP-5343 plans to make nftables the default in 1.40. Between 2018 and 2021, “Cilium vs kube-proxy” usually meant “eBPF hash maps vs linear iptables chains”. In 2026 the honest comparison is against nftables, and on architecture alone the gap should be smaller. What remains in eBPF’s favour is socket-level load balancing that removes per-packet NAT entirely, XDP-level NodePort handling, and fewer trips through netfilter hooks.
Heavy per-packet compute and program stacking are the last two. Calico’s documentation argues that per-packet work such as decrypting and re-encrypting flows “would not be efficient” in eBPF and frames the trade-off as CPU cost (“If eBPF is very fast but takes up 80% of your resources, then it’s like a Lamborghini”) (Calico docs). Calico sells both iptables and eBPF data planes, so that is a vendor framing, and the same page’s claim that eBPF “must be translated to bytecode” while iptables “is already compiled” is misleading on JIT-enabled kernels. Tail calls, multi-program dispatchers, chained tc filters, indirect calls under retpolines and per-packet map lookups each add cost, and the costs add up.
Reading a vendor benchmark
Cilium’s benchmark page is useful, and it shows its own caveats if you read it to the end. It is still a vendor benchmark. It compares Cilium 1.9.6 with Calico 3.17.3 on Linux 5.10, an AMD Ryzen 9 3950X and Intel E810 100G NICs: 2021 versions, on a page that now ships with the Cilium 1.20 docs. The headline configuration is labelled “eBPF host-routing, kube-proxy replacement, No CT”; the page never defines “No CT”, and it is a tuned setup and not a default. Calico’s eBPF data plane (3.17.3) is in the configuration list and in several charts, including 32-process TCP_RR, but not in the 32-process TCP_CRR results, where the page says “We have not been able to measure stable results for the Calico eBPF datapath”. The headline vendor claim is that “Cilium can achieve close to 1M requests/s in this test while consuming about 30%” of system CPU in TCP_RR. The page also admits that kube-proxy replacement combined with WireGuard “is currently slightly slower”, and that IPsec was more CPU-efficient than WireGuard, which it offers to explain with AES-NI. That explanation is a hypothesis. A blog post that quotes only the headline is quoting marketing.
My lab: what a veth pair can and cannot tell you
I wanted my own numbers, with my own caveats attached. The setup is in Figure 4: a privileged Debian 13 container on Docker Desktop’s linuxkit VM, 10 vCPUs and about 8 GB of RAM, Linux 7.0.14 aarch64, BPF JIT always on (bpf_jit_enable and bpf_jit_harden sysctls are absent), two network namespaces joined by a veth pair, no physical NIC. The kernel was built without pktgen, so I used trafgen 0.6.9 from netsniff-ng, which sends through an AF_PACKET TX_RING. Docker Desktop leaves net.core.rmem_max / wmem_max read-only, so trafgen ran with --no-sock-mem. It sent 60-byte frames (64 on the wire) as fast as it could, one UDP flow from 10.99.0.1:12345 to 10.99.0.2:9, with nothing listening on port 9.
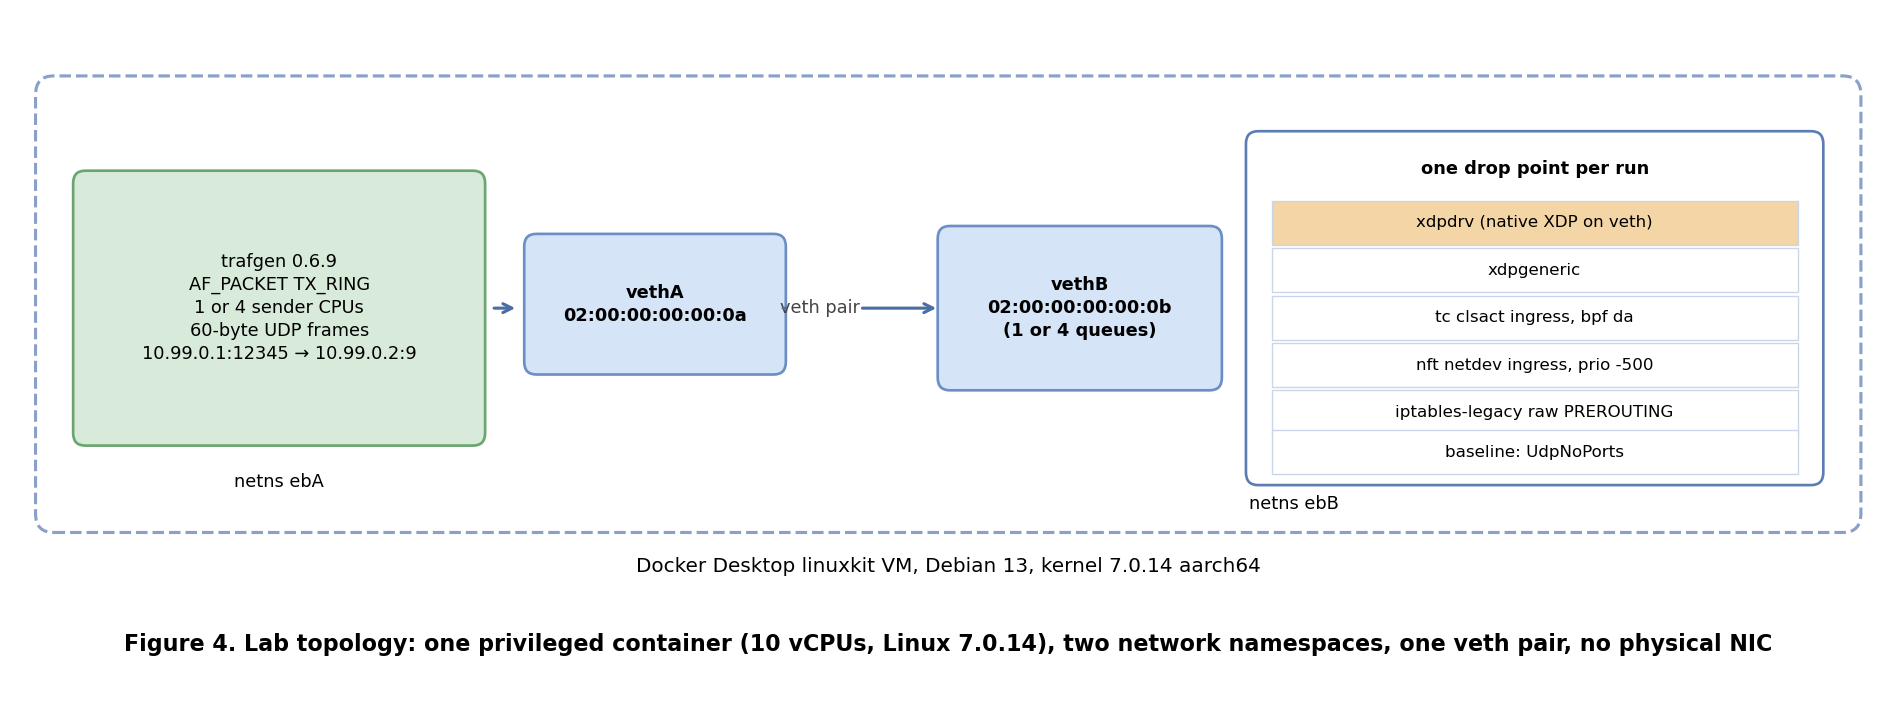
Each of six modes dropped UDP port 9 at a different point on vethB. Baseline had no filter, so packets crossed the whole IP and UDP stack and died as UdpNoPorts. The others were an iptables-legacy raw PREROUTING rule, an nft netdev ingress chain at priority -500, the XDP program above attached with xdpdrv and with xdpgeneric, and an equivalent tc program on clsact ingress in direct-action mode. Each run started trafgen, waited 2 s and took counter snapshots 10 s apart; each mode ran 5 times in each of three configurations, 90 runs in all. “Drop pps” is the filter’s own counter. I also recorded vethA tx and vethB rx, but veth derives each device’s counters from its peer’s (veth_get_stats64), so those two always agree and are not independent checks on loss. The attachments are plain iproute2, iptables and nft:
ip -n ebB link set dev vethB xdpdrv     obj bench/xdp_drop.o sec xdp
ip -n ebB link set dev vethB xdpgeneric obj bench/xdp_drop.o sec xdp
tc -n ebB qdisc add dev vethB clsact
tc -n ebB filter add dev vethB ingress bpf da obj bench/tc_drop.o sec tc
ip netns exec ebB iptables-legacy -t raw -A PREROUTING -p udp --dport 9 -j DROP
ip netns exec ebB nft -f - <<NFT
table netdev lab {
  counter dropped { }
  chain ing { type filter hook ingress device "vethB" priority -500; policy accept;
    ip protocol udp udp dport 9 counter name "dropped" drop
  }
}
NFT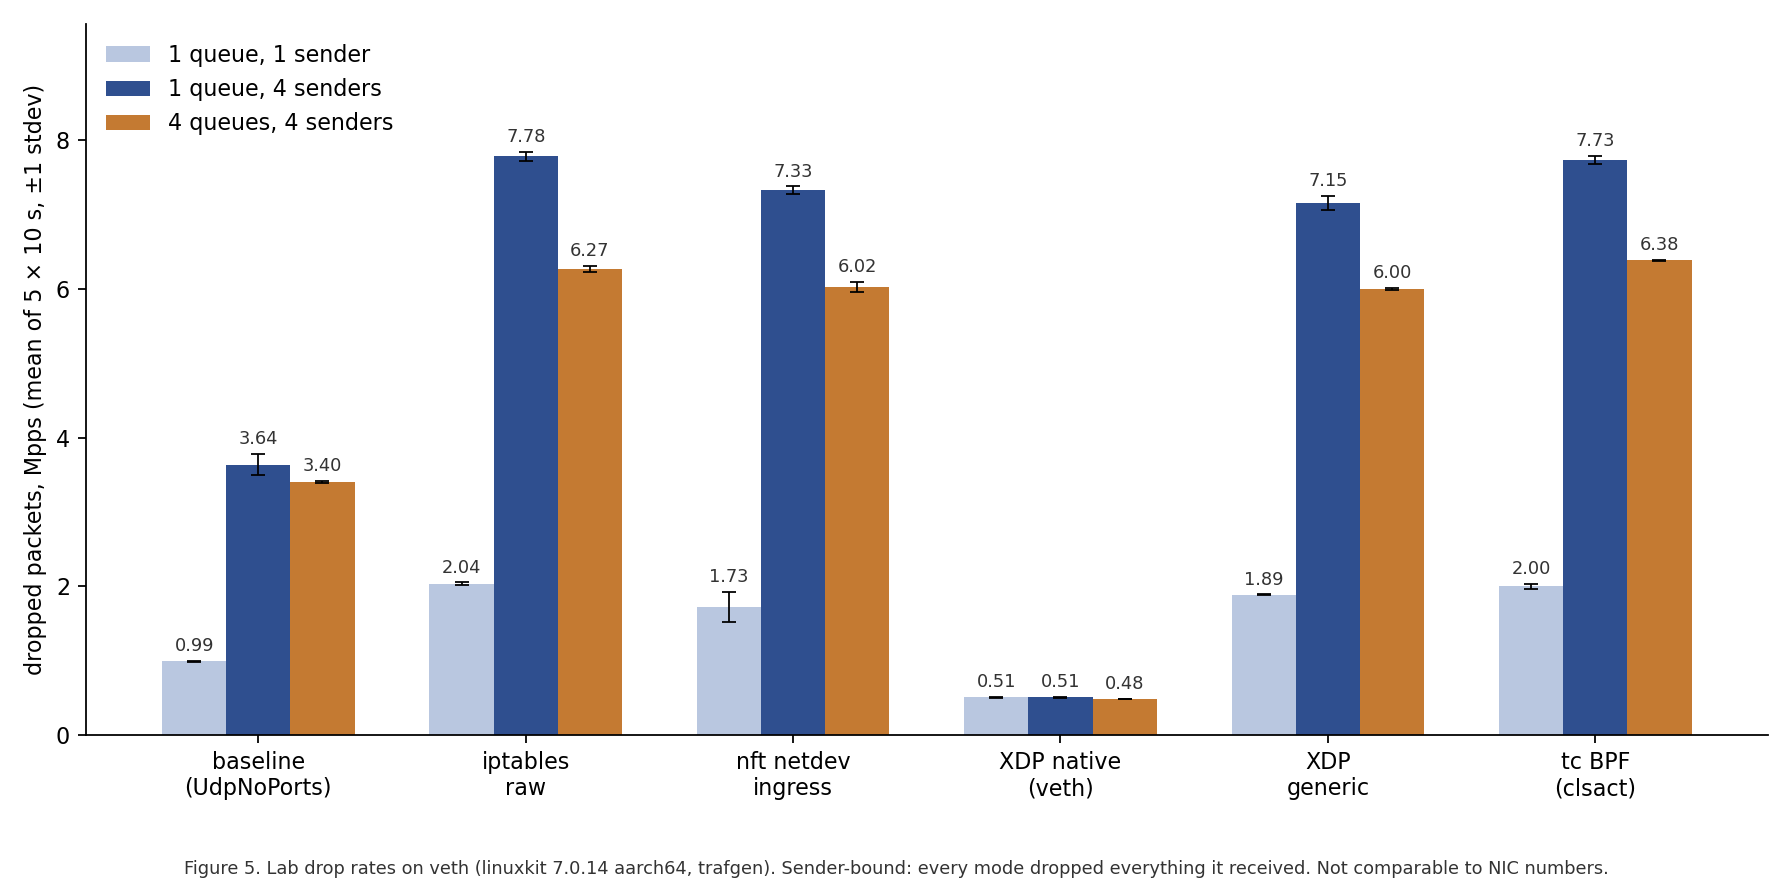
| veth queues / sender CPUs | baseline | iptables raw | nft ingress | XDP native | XDP generic | tc BPF |
|---|---|---|---|---|---|---|
| 1 / 1 (Mpps) | 0.994 | 2.039 | 1.725 | 0.510 | 1.886 | 2.001 |
| 1 / 4 (Mpps) | 3.637 | 7.782 | 7.329 | 0.508 | 7.15 | 7.729 |
| 4 / 4 (Mpps) | 3.400 | 6.271 | 6.023 | 0.484 | 5.995 | 6.385 |
Before reading anything into this table, the limits. In every run the filter counter matched the packets vethB received, and vethB rx_dropped was 0. Every mode dropped everything that reached it, so the sender and the veth path set the rate, and none of these numbers is the capacity of a filter. Sender and receiver shared one 10-vCPU VM, and my ns/pkt figures (in the raw data) include the sender’s work. Steal time is excluded from busy and was 0.0% on every row. Other processes were running in the same VM. The traffic was one minimum-size flow with no RSS and no real interrupts. Across five 10-second runs, the noisiest cell, nft ingress at 1 / 1, had a relative standard deviation of about 12% (1.725 ± 0.204 Mpps) and a min-to-max range of 28% (1.384 to 1.873). Native XDP cells were tight. Above all, these numbers cannot be set next to the paper’s 24 Mpps on mlx5. That figure is XDP_DROP in a hardware driver before any skb exists. In my setup trafgen builds an skb for every packet and native veth XDP then converts it into an xdp_buff, so XDP’s main advantage is absent by construction.
What the table does show fairly is the relative cost of the software drop points on the veth/skb path. With one sender, sender and receiver share CPU 0, which is 100% busy in every mode. iptables raw (2.039 Mpps) and tc BPF (2.001) are the fastest early drops, generic XDP is 1.886, nft is 1.725. Native XDP is 0.510 Mpps, slower than baseline (0.994), because every packet still crosses the full send path and then the native veth XDP copy. With four senders on one queue, iptables raw, tc, nft and generic XDP sit between 7.15 and 7.78 Mpps. iptables raw and tc BPF are neck and neck, and the fastest drop in that row is iptables raw.
And then there is native XDP, which was the slowest filter in every configuration, stuck at about 0.5 Mpps whether I used one sender or four. I followed it up, with one queue only. In a 5-second, four-sender check, xdpdrv showed 2,512,272 packets transmitted on vethA with 0 tx_dropped, against 36,799,639 transmitted and none dropped for xdpgeneric. Some of the 10-second CSV rows still recorded sender-side tx_dropped for native XDP (one 1-queue/4-sender run at 1.28 Mpps dropped; three of the 4-queue runs between 0.19 and 0.89 Mpps). The filter rate in those rows stayed ~0.48–0.50 Mpps. kprobe counts showed almost every veth_poll call on one CPU (1,461,797 calls on cpu1 in 5 s, against 1 on cpu0). A 99 Hz profile put cache_line_size as the largest leaf at 23.2% of non-idle samples; the hottest stack (22.3%) was cache_line_size called from skb_pp_cow_data called from veth_xdp_rcv_skb. _raw_spin_lock was 3.1% of leaves. Native veth XDP needs the data in page-pool memory, so it copies every packet. (skb_copy_ubufs showed up too, but that copy belongs to the AF_PACKET path and happens in every mode.) The NAPI CPU was about 67% busy; the other three loaded CPUs were about 60% busy.
My reading of the one-queue case is that one NAPI context drains veth’s native XDP path with a copy per packet, and extra senders do not raise the drop rate. That explanation is plausible and unproven, and because every diagnostic ran with one queue, it does not explain the four-queue row. I did not check which queue each sender used, read the veth source or collect lock statistics, and I did not investigate why the other modes were slower with four queues than with one. The general lesson holds anyway: “native” XDP on a virtual device is a different code path from native XDP in a NIC driver, and it can lose to generic XDP. If your nodes are VMs, measure on your virtual NIC before you believe a number measured on someone else’s ConnectX.
Where the big wins really come from
The big gains come from architecture. In Cloudflare’s synthetic benchmark, dropping before the stack allocates anything took one core from 175 kpps for an application-level drop to 10.1 Mpps with XDP. Replacing per-packet NAT with per-connection socket-level load balancing removes the DNAT entirely. Replacing linear rule lists with hash or LPM maps is the same win nftables got with verdict maps. Skipping layers, as Cilium’s eBPF host routing and netkit devices (kernel 6.8 or later, beta in Cilium) do, avoids the veth and upper-stack traversal (Cilium tuning). BIG TCP, which raises GSO/GRO sizes from 64k to 192k in Cilium’s configuration on supported NICs, is a kernel feature that Cilium configures, not an eBPF one. Each of them comes from doing less work, doing it once per connection instead of once per packet, or doing it before the expensive part starts.
Debugging the debugger
My third central point is the one I feel most in my hands: debugging and observing eBPF programs themselves is still painful. Stack traces are limited, events from different layers are hard to correlate, and a bad program in production is a kernel-level incident. A program that is invisible to normal tools and runs before tcpdump creates a new class of outage, the one where “the packet vanished” and every familiar tool agrees that it never existed.
bpftool, and what it will not show you
bpftool is the reference CLI and the first thing to run. In my lab it showed the benchmark program and its attachment like this:
$ bpftool prog show id 1062
1062: xdp  name xdp_drop_udp9  tag f696d134c272b989  gpl
	loaded_at 2026-11-03T14:20:19+0000  uid 0
	xlated 544B  jited 416B  memlock 4096B  map_ids 117
	btf_id 446
$ bpftool net show dev vethB
xdp:
vethB(11) driver id 1062
The xlated 544B jited 416B sizes, the tag, and the two dumps below are from the objects I loaded in this run, the same bench/xdp_drop.o that includes the byte counter. bpftool net show lists XDP, tcx, netkit, legacy tc, flow_dissector and netfilter attachments, and it is the fastest way to find a second program that has attached to “your” interface. bpftool link show lists links and can show the processes holding them; for the bpffs paths where links are pinned you need bpftool -f link show. With sysctl kernel.bpf_stats_enabled=1, prog show adds run_time_ns and run_cnt, and dividing one by the other gives the mean cost per invocation; the sysctl documentation warns that this “causes a slight reduction in performance on each program run”. bpftool prog profile reads perf counters per run, and bpftool prog run PROG data_in FILE repeat N drives BPF_PROG_TEST_RUN with a crafted packet and no traffic at all, which is the basis of most unit testing.
bpftool prog dump xlated id N linum shows the program after the verifier’s rewrites, interleaved with source lines. That is where I could see the verifier inlining bpf_map_lookup_elem on a per-CPU array into a direct index:
; __u64 *v = bpf_map_lookup_elem(&drop_cnt, &k);
  29: (18) r1 = map[id:117]
  31: (07) r1 += 312
  32: (61) r0 = *(u32 *)(r2 +0)
  33: (35) if r0 >= 0x2 goto pc+5
  34: (67) r0 <<= 3
  35: (0f) r0 += r1
  36: (79) r0 = *(u64 *)(r0 +0)
  37: (bf) r0 = &(void __percpu *)(r0)
  38: (05) goto pc+1
  39: (b7) r0 = 0
What runs is not what you wrote, and this view is how you find out. The native-code view was a different story. bpftool prog dump jited failed with Error: No JIT disassembly support, because the Debian bpftool 7.5.0 build has no disassembler, and its file variant failed the same way. The listing below comes from a small script, obs/dump_jit.py, that fetches the JIT image through bpf(2) with BPF_OBJ_GET_INFO_BY_FD and writes it to a file, which I then disassembled with objdump -b binary -m aarch64. The 416 bytes start with PAC and frame setup, and the first bounds check is visible as plain arm64 (the comments are mine):
   8:	d503233f 	paciasp
   c:	a9bf7bfd 	stp	x29, x30, [sp, #-16]!
  10:	910003fd 	mov	x29, sp
  ...
  30:	f9400402 	ldr	x2, [x0, #8]      // data_end
  34:	f9400001 	ldr	x1, [x0]          // data
  38:	91000023 	add	x3, x1, #0x0
  3c:	91003863 	add	x3, x3, #0xe      // data + 14
  40:	eb02007f 	cmp	x3, x2
  44:	540009a8 	b.hi	0x178             // past data_end: return XDP_PASS
Distribution builds of your tools may lack the views you assume exist. Find out before an incident.
printk, verifier logs and tracing the kernel around your program
bpf_printk writes into the tracefs buffer, which you read through /sys/kernel/tracing/trace_pipe (the man page warns that lines are discarded while trace itself is open). In my lab a one-line debug program produced exactly what you would hope for:
ping-67900 [003] ..s5. 23697.967250: bpf_trace_printk: xdp_printk: ifindex=11 proto=1 len=98One line per packet, in a buffer shared by every program and every user of trace_printk on the host. Fine on a laptop. Wrong for production. Newer kernels add per-program BPF streams that bpftool prog tracelog can read, and according to the bpftool man page, waiting for new stream output needs a kernel that supports opening a stream as a file descriptor, “introduced upstream in Linux 7.4”.
The verifier log remains the most important debugging artefact. At log level 2 it prints the register state after every instruction, and the mark_precise backtracking lines in my demo 02 log show precision tracking walking backwards through the loop body, iteration after iteration. Reading those logs is a skill, and it is a skill most teams have exactly one person for.
bpftrace is the tool for the ad hoc question “which kernel function is dropping my packets”. On the baseline path, attaching to tracepoint:skb:kfree_skb and aggregating by drop reason answered it in four seconds:
$ bpftrace -e 'tracepoint:skb:kfree_skb { @reason[args->reason] = count(); } interval:s:4 { exit(); }'
...
@reason[SKB_DROP_REASON_NO_SOCKET]: 1728512
It also handed me a trap I now expect to meet again. I wanted to count calls to veth_xdp_rcv, a function that is plainly there in the source:
$ bpftrace -e 'kprobe:veth_xdp_rcv { @calls[cpu] = count(); } interval:s:4 { exit(); }'
Attaching 2 probes...


@calls[0]: 928512
On this linuxkit build the plain name attached. veth_xdp_rcv_bulk_skb.constprop.0 and netif_receive_generic_xdp did not: bpftrace warned they were not traceable. A function in the source is not necessarily a symbol you can trace on a given build, and kprobe attach points are explicitly not stable ABI. For “why did this bpf() call return -EINVAL”, retsnoop records call stacks and error returns of selected kernel functions; its README warns that tracing kernel internals is “inherently tricky and potentially disruptive”.
The blind spot, and the hooks that disagree
Figure 1 already showed the worst part: native XDP runs before the ptype_all taps, so tcpdump does not see packets that XDP drops or redirects. tc ingress runs after the taps, so tcpdump does see packets that tc then drops. For XDP you need in-program counters, sampled export through a perf or ring buffer (exactly what Cloudflare’s L4Drop does), or xdp-tools’ xdpdump. At cluster scale, Cilium’s Hubble serves flow events per node over a local socket, Hubble Relay extends that to the whole cluster, and L7 visibility requires traffic to pass through Cilium’s Envoy, so you pay the proxy cost for that visibility.
Two pitfalls from my own benchmark show how hooks at different layers disagree about what “received” even means. The first: my tc program matched zero packets. Skbs from trafgen’s AF_PACKET TX_RING were nonlinear, with only the 14-byte Ethernet header in the linear area (AF_PACKET’s tpacket_fill_skb copies just the device’s hard_header_len there), so direct packet access failed my data + 42 > data_end check and every packet sailed through untouched. BPF_PROG_TEST_RUN with a linear test packet returned TC_ACT_SHOT, which isolated the cause. The fix is one helper call:
SEC("tc")
int tc_drop_udp9(struct __sk_buff *skb)
{
    // AF_PACKET TX_RING skbs arrive nonlinear: only the Ethernet header is linear.
    // Compare packet pointers (do not subtract them) so this loads without CAP_PERFMON.
    if ((void *)(long)skb->data + ETH_HLEN + sizeof(struct iphdr) + sizeof(struct udphdr) > (void *)(long)skb->data_end)
        bpf_skb_pull_data(skb, ETH_HLEN + sizeof(struct iphdr) + sizeof(struct udphdr));
    void *data = (void *)(long)skb->data;
    void *data_end = (void *)(long)skb->data_end;
    /* ... same Eth/IPv4/UDP parsing as the XDP version, then return TC_ACT_SHOT ... */
}
In tc, “the packet is shorter than my header” may only mean “the header is not in the linear area”. XDP did not hit this, because native veth XDP copies into page-pool memory and generic XDP linearises the skb.
The second pitfall: after I recreated the namespaces, veth came up with new random MACs, but my generated frames still carried the old destination MAC. The stack classified them as PACKET_OTHERHOST and dropped them silently, so UdpNoPorts stayed at zero. XDP and the nft netdev chain, which run before the L2 host check, still counted the packets and appeared to work perfectly. I discarded those runs and pinned the MACs in the setup script. Had I not been cross-checking counters at three layers, I would have published nonsense.
The operational model: who owns the eBPF layer?
My fourth point is the one I think decides whether eBPF networking succeeds in a given organisation. Netfilter has tables and chains, and two tools that both use iptables-nft at least see each other’s rules. eBPF hooks historically had nothing like that. A netlink XDP attach replaced whatever was there. A tc filter replace ... bpf, or a loader using the same replace semantics, at the same prio and handle swapped out the previous filter; a plain tc filter add is an exclusive create and fails instead. A loader that died left its program running forever. The data plane on a node is a set of kernel objects with no built-in owner, shared by every agent on that node: the CNI, security agents, observability agents, load balancers.
This is not hypothetical. Daniel Borkmann’s TCX commit message (e420bed02507, first in v6.6) records two incidents. From Meta: “We at FB had outages due to such permanent BPF attachment semantics.” From Cilium: “another Kubernetes application using tc BPF attached to the same prio/handle of cls_bpf, accidentally wiping all Cilium-based BPF programs from underneath it.” BPF links (v5.7), XDP links (v5.9) and TCX (v6.6) exist because tools clobbered each other.
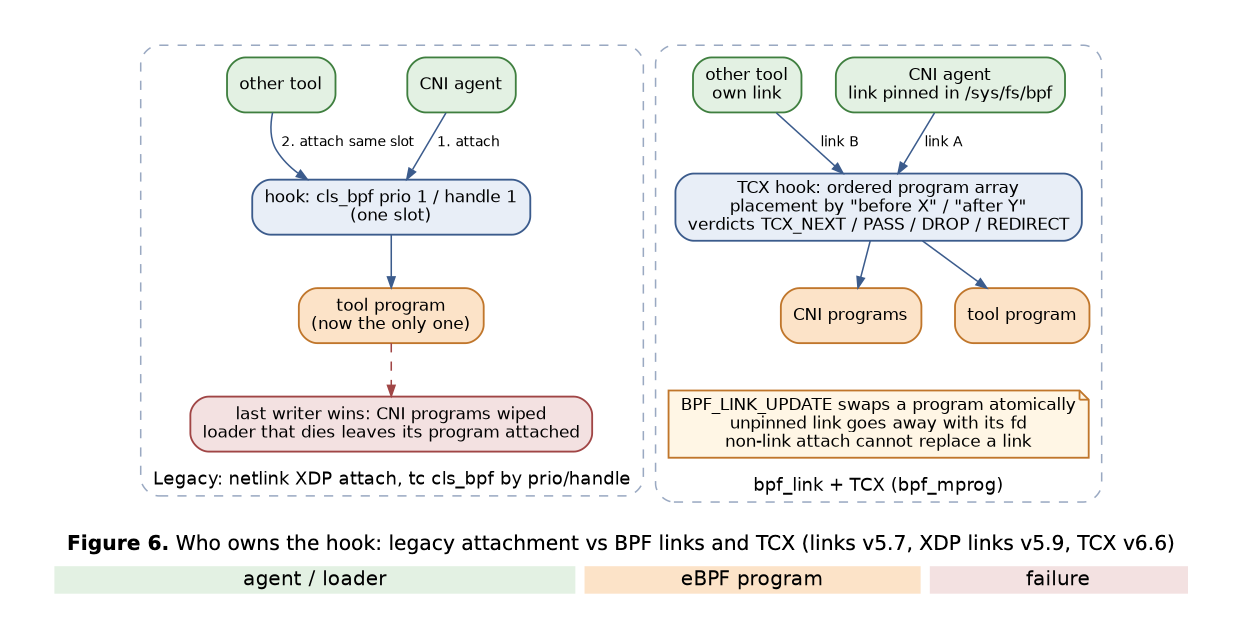
A BPF link is a kernel object for one attachment. It “holds a single reference to keep BPF program alive”, while “hook points do not reference a BPF link, only the application’s fd or pinning does”. If the owning process exits without pinning the link, the attachment goes away: “safe, auto-detachable behavior by default”. Pinning the link in bpffs keeps it alive across agent restarts, so an agent upgrade does not have to take the attachment down with it. BPF_LINK_UPDATE swaps the program behind a link atomically, so packets see the old or the new program and never an empty hook. The replacement rules protect link owners from legacy tools: “BPF links cannot replace other BPF links, BPF links cannot replace non-BPF links, non-BPF links cannot replace BPF links and lastly only non-BPF links can replace non-BPF links.” TCX also replaces numeric tc priorities, which two vendors pick independently, with relative ordering (“before X”, “after Y”) through the bpf_mprog API, and programs return TCX_NEXT, TCX_PASS, TCX_DROP or TCX_REDIRECT. Existing cls_bpf programs can migrate “without needing to change the program’s source code, just the BPF loader mechanics” (e420bed02507).
XDP sharing was solved in userspace first. libxdp loads a dispatcher whose slots are stub functions and uses the freplace program type to replace each stub with a user program (libxdp protocol). At most ten programs (MAX_DISPATCHER_ACTIONS) share an interface, each with a priority and a chain_call_actions bitmap that says which return codes continue to the next program. The configuration lives in the dispatcher’s rodata, so changing the set means building a new dispatcher and atomically replacing the old one, and once a newer dispatcher is loaded, “old versions of the library will be locked out”. The protocol works only if every XDP loader on the host honours it, through libxdp or its own implementation of the dispatcher protocol. One tool that attaches with raw netlink breaks the arrangement. That is a coordination problem wearing a technical costume, and it is the shape of most eBPF operational problems.
Versioning, testing and rolling
One common shipping unit for C eBPF code is a libbpf skeleton generated with bpftool gen skeleton prog.bpf.o > prog.skel.h, which embeds the object and exposes typed open, load, attach and destroy functions. You open the object, set read-only constants such as feature flags, then load (CO-RE relocation and verification happen here), then attach through links. Because the rodata is frozen before load, the verifier sees those values as constants and prunes dead branches. That gives compile-once binaries with load-time specialisation per kernel and configuration. It is one workflow, not the only one: Cilium’s agent compiles its datapath with clang at runtime (Cilium system requirements), and Katran loads ELF objects through libbpf’s object API.
It also means the verifier is part of what you test, on every kernel you support. Helpers, kfuncs, map types and verifier behaviour change per release. A program that loads on 6.12 may hit the complexity limit on 5.15 because pruning improved in between, and a program written against the 2 KiB stack of v7.4 will be rejected on v7.3. So CI has to boot multiple kernels, with tools such as vmtest or Cilium’s little-vm-helper, and unit-test programs with BPF_PROG_TEST_RUN. My demo 02 adds a less obvious requirement: budget for verifier time, since a single rejection spent 1.58 s in the verifier and took 72.81 s as a debug load. Demo 06 adds another: run your load tests with the capabilities production will have, not as root.
The kernel version is a product decision, and the floors are concrete:
| Feature | Minimum kernel |
|---|---|
| Bounded loops | 5.3 |
| Katran (README install requirement, tested on Ubuntu 20.04) | 5.6 |
| bpf_loop() | 5.17 |
| XDP multi-buffer | 5.18 |
| BBR for pods (Cilium bandwidth manager) | 5.18 |
| BIG TCP IPv6 / IPv4 | 5.19 / 6.3 |
| TCX and links for tc | 6.6 |
| netkit (beta in Cilium) | 6.8 |
| 2 KiB stack for JITed programs | 7.4 (rc1 only, pre-release) |
Enterprise distributions backport BPF features unevenly, so the version number is only a hint. Probe at runtime with bpftool feature probe or libbpf’s feature detection instead of parsing uname -r.
When eBPF meets everything else on the node
The interactions are where operational ownership gets tested, and each failure has a specific shape.
Ordering hides traffic from netfilter. Cilium’s own troubleshooting docs describe hosts running both Kubernetes and Docker where a Service is backed by an unpublished Docker container. “Cilium translates the ClusterIP in the eBPF datapath before the packet reaches netfilter”, so the packet reaches Docker’s raw PREROUTING rules already addressed to the container, Docker’s per-container protection there may drop it before it gets to DOCKER-USER, and any allow rule in DOCKER-USER “has no effect for this traffic” (Cilium KPR docs).
Socket-LB breaks anything that expects to see a ClusterIP inside the pod. Since the rewrite happens at connect(), a sidecar that intercepts traffic to the original ClusterIP never sees it, and Cilium offers socketLB.hostNamespaceOnly=true for Istio sidecar setups and for KubeVirt, Kata Containers and gVisor, falling back to the tc load balancer on the veth.
Socket-LB state can leak. Cilium documents that the cilium_lb4_reverse_sk and cilium_lb6_reverse_sk LRU maps can fill with stale entries for unconnected UDP sockets, after which “socket termination may become unreliable until the node is restarted”. eBPF state is kernel state, and map sizing is capacity planning.
Cilium documents running its kube-proxy replacement alongside kube-proxy. If both run, two translation layers act on the same traffic independently, and which one wins depends on hook order and on whether socket-LB already rewrote the connection. The hazard is moving Services from one to the other on a live cluster: Cilium warns that existing connections will break, since “both NAT tables are not aware of each other”, and its guide installs with kubeadm’s --skip-phases=addon/kube-proxy to avoid that handover. In the same spirit, two CNIs with eBPF data planes on one node both want the tc or TCX hooks and both want to replace kube-proxy. Before TCX, the last one to attach won.
Hardware offload is the last interaction, and mostly a non-event. The only upstream eBPF offload driver is Netronome’s nfp, offload restricts helpers and map types, and the one independent measurement I have is not flattering.
Put those together and the ownership question becomes concrete. Someone has to decide which component may attach where, in which order, with which capabilities, on which kernels, and how its maps are sized and monitored. On a node running a CNI, a security agent and an observability agent from different vendors, that someone is rarely obvious, and the kernel will not decide for you.
Case studies: service mesh and DDoS
Sidecarless does not mean eBPF
The two main sidecarless meshes both move the proxy to the node, and only one of them is primarily eBPF.
Cilium’s service mesh runs L3/L4 policy, load balancing and observability in eBPF. L7 features such as HTTP routing, L7 policy and L7 visibility in Hubble go to an Envoy that is either embedded in the Cilium agent or run as the separate cilium-envoy DaemonSet, one per node (Cilium Envoy docs). Cilium’s mutual authentication was a beta feature with an unusual design, and it is on the way out: Cilium 1.20 deprecated it (1.20 upgrade notes), and the 1.21 notes on the main branch say it has been removed (1.21 upgrade notes). The 1.20 docs say it “brings the mutual authentication handshake out-of-band for regular connections” and that “users must enable encryption” (WireGuard or IPsec) to meet “most of the common requirements for service-to-service authentication and encryption”, with identities from SPIFFE/SPIRE (Cilium mutual authentication). The handshake authenticates identities between nodes; the data packets are then allowed by eBPF policy and encrypted by node-level WireGuard or IPsec. They are not carried inside a TLS session between the two workloads. Whether that is equivalent to per-connection mTLS is debated, and I found no primary-source security analysis either way; the feature page’s own roadmap still lists a per-connection handshake, a documented security model and a penetration test as TODO. Cilium now points users to Ztunnel Transparent Encryption, also beta, which redirects pod traffic to a per-node ztunnel with iptables rules inside each pod’s network namespace (Cilium ztunnel).
Istio ambient reached GA in 1.24 (Istio blog). It splits the mesh into ztunnel, a per-node L4 proxy written in Rust that does mTLS using HBONE (HTTP CONNECT tunnelling on port 15008), and optional Envoy waypoint proxies for L7 (Istio data plane). Its traffic capture does not use eBPF. The istio-cni node agent “enters the pod’s network namespace and establishes network redirection rules”, and the documented way to check is iptables-save inside the pod, which shows Istio chains “added to the NAT and Mangle tables in netfilter/iptables within the application pod’s network namespace” (Istio traffic redirection). ztunnel then opens listening sockets on ports 15008, 15006 and 15001 inside each pod’s namespace using a namespace file descriptor. Istio says this lets ambient “work alongside any Kubernetes CNI plugin”, Cilium included. In ambient, application connections to the same destination identity share one HTTP/2 tunnel secured with mTLS, and the tunnel’s identities are the source and destination workloads’, never ztunnel’s own (Istio HBONE). The encryption happens in user space, in ztunnel.
So the trend is fewer proxies, shared per node, and eBPF is one way of steering traffic to them. Its strongest case in a mesh is L3/L4 policy and service load balancing without a proxy in the path. L7 still needs a proxy in both designs. Cilium’s per-node Envoy is also a shared failure and noisy-neighbour domain: one tenant’s L7 load affects every pod on the node. Istio keeps only L4 on the node, in ztunnel, and deploys and scales waypoints independently for the namespaces, Services or workloads that use them (Istio waypoints). In both designs, a per-node proxy means a compromised node holds the keys for every workload on it. A sidecar isolated that, and paid for it in memory per pod. Node-level WireGuard or IPsec encrypts between nodes, so pods on the same node may talk unencrypted, depending on the encryption mode and version.
Why DDoS is eBPF’s best case
DDoS mitigation is the clearest win because it lines up everything XDP does well. The decision is cheap, a header match. Most traffic gets dropped, so there is no point building an sk_buff. Rules change every few seconds, so loadable programs and maps beat recompiling anything. And the same box keeps serving legitimate traffic through the normal stack.
Cloudflare’s Marek Majkowski measured one technique after another on one of their “Intel servers, with a 10Gbps network card”, steering all packets to a single RX queue and core, with turbo off (How to drop 10 million packets per second). It is a synthetic, single-queue microbenchmark from 2018, self-reported by Cloudflare about its own systems, so the ranking matters more than the absolute values:
| Technique | Rate |
|---|---|
| Drop in the application | 175 kpps |
| Application, conntrack disabled | 333 kpps |
| BPF socket filter | 512 kpps |
| iptables INPUT | 608 kpps |
| iptables raw PREROUTING | 1.688 Mpps |
| nftables ingress | 1.53 Mpps |
| tc ingress u32 | 1.8 Mpps |
| XDP | 10.1 Mpps |
Set this ladder next to my veth table and the argument of this article fits in two tables. On a real NIC driver, XDP is in a different league from everything above it, because it runs before the skb exists. On veth, where an skb exists before the program ever runs, XDP falls back into the pack, and in one configuration to the bottom of it.
Cloudflare’s production story follows the same logic. Gatebot, the automatic mitigation system described in 2017, was engaged 30 to 1500 times a day by its iptables pipelines alone, and only the largest attacks, above 1M packets per second per server, went to Floodgate’s partial kernel bypass. Arthur Fabre’s L4Drop post describes replacing that bypass, which ran on a single core, with always-on XDP filtering. Rules are compiled to C and then to eBPF with clang, loops are not allowed, and random samples of all received traffic, taken before anything is dropped, are exported with perf_event_output, which is the answer to the tcpdump blind spot. During a large attack, CPU use rose by about 10% and softirq time doubled while the packet rate rose 40 times. David Wragg’s Unimog post describes an XDP layer-4 load balancer running on every edge server rather than on dedicated hardware, encapsulating with GUE and using a forwarding table with more than 100 times as many buckets as servers, plus Beamer-style “daisy chaining” so connections survive table changes. That is the middlebox, folded into every server.
Meta’s Katran replaced an IPVS-based first-generation L4 balancer that had been in use for more than four years. It runs XDP in driver mode with a Maglev-style consistent hash and an LRU connection table in per-CPU maps. It does direct server return only, with IPIP encapsulation whose outer source address varies so that receiving NICs spread load with RSS, and it refuses fragments, IP options and packets above about 3.5 KB. The XDP paper measured it against IPVS:
| Cores | 1 | 2 | 3 | 4 | 5 | 6 |
|---|---|---|---|---|---|---|
| Katran (XDP), Mpps | 5.2 | 10.1 | 14.6 | 19.5 | 23.4 | 29.3 |
| IPVS, Mpps | 1.2 | 2.4 | 3.7 | 4.8 | 6.0 | 7.3 |
That is 4.3 times IPVS on one core and about 3.9 to 4.2 times on two to six, scaling roughly linearly. The XDP paper’s authors, from Karlstad University, Red Hat, Cilium.io, Quantonium and Cumulus, measured it by running Facebook’s open-source Katran on their own 2018 testbed, and it has not been independently reproduced. Cilium rebuilt the same architecture for Kubernetes Services, for external (north-south) traffic; in-cluster connections through socket-LB get their backend at connect() and are not subject to Maglev. The Maglev table defaults to 16381 entries, suitable for about 160 backends, and should be more than 100 times the number of backends so that the backends’ shares of the table differ by at most 1%. That is not the same as reassignment: with the default table and 163 backends, the current docs measure about 1.6% of the remaining backends’ slots moving when one backend is removed (Cilium latest docs). Cilium also has XDP acceleration since 1.8, and DSR that can carry the service address in an IP option, an IPv6 extension header, Geneve or IPIP.
What to actually do
If you are deciding whether to move a data plane into eBPF, the mechanics above turn into a short list of obligations. Measure against kube-proxy’s nftables mode, not against the iptables of 2019, and measure your connection rate as well as your packet rate. Measure on your NIC and your driver, in native mode, with Spectre mitigations as they will be in production, and treat any number from a paper, a vendor page or my veth pair as a hint about mechanism rather than a forecast. Treat the verifier as a design input from day one: bound every loop with a constant, keep large scratch space in per-CPU maps, zero your keys, and expect some correct and elegant programs to be unloadable. Test loads on every kernel you ship to and with the capabilities you will grant, and budget CI time for rejections. Attach through links and TCX, pin what must survive restarts, and run bpftool net show on your nodes to find out who else is already there. Decide which team owns each hook on a node and which maps it must size and watch. And build observability for the observability layer before you need it: in-program counters, sampled drop export, drop-reason tracing, and a bpftool build that can actually disassemble.
eBPF gives you a programmable data plane inside the most scrutinised piece of software on the machine, and the price of admission is a static analyser that decides what you are allowed to express. Look at where the packet dies, and you will know what eBPF actually bought you.
* * *
Sources
Every fact in the article comes from these primary and secondary sources. Lab artefacts (verifier logs, benchmark CSVs, profiles, scripts) are kept locally with the lab files and are not public URLs.
- https://kubernetes.io/blog/2025/02/28/nftables-kube-proxy/
- https://github.com/kubernetes/enhancements/blob/master/keps/sig-network/3866-nftables-proxy/README.md
- https://kubernetes.io/docs/reference/networking/virtual-ips/
- https://www.kubernetes.dev/resources/keps/5495/
- https://doc.dpdk.org/guides/prog_guide/ethdev/ethdev.html
- https://blog.cloudflare.com/meet-gatebot-a-bot-that-allows-us-to-sleep/
- https://www.tcpdump.org/papers/bpf-usenix93.pdf
- https://lwn.net/Articles/599755/
- https://www.kernel.org/pub/linux/kernel/v2.1/patch-2.1.75.gz
- https://github.com/torvalds/linux/commit/0a14842f5a3c
- https://github.com/torvalds/linux/commit/e2cfabdfd075
- https://github.com/torvalds/linux/commit/bd4cf0ed331a
- https://docs.kernel.org/bpf/bpf_design_QA.html
- https://github.com/torvalds/linux/commit/99c55f7d47c0
- https://lwn.net/Articles/603983/
- https://github.com/torvalds/linux/commit/4f3446bb809f
- https://lwn.net/Articles/743288/
- https://github.com/torvalds/linux/commit/a493a87f38cf
- https://github.com/torvalds/linux/commit/979d63d50c0c
- https://arxiv.org/abs/1312.1719
- https://www.intel.com/content/www/us/en/content-details/827577/intel-tofino-products-pcn-827577-00-product-discontinuance-tofino-end-of-life.html
- https://raw.githubusercontent.com/torvalds/linux/master/net/core/dev.c
- https://docs.cilium.io/en/stable/network/kubernetes/bandwidth-manager/
- https://raw.githubusercontent.com/torvalds/linux/master/include/uapi/linux/if_link.h
- https://raw.githubusercontent.com/tohojo/xdp-paper/master/xdp-the-express-data-path.pdf
- https://raw.githubusercontent.com/libbpf/bpftool/main/docs/bpftool-net.rst
- https://kernelnewbies.org/Linux_5.18
- https://github.com/torvalds/linux/commit/ea5d49bdae8b
- https://github.com/torvalds/linux/commit/f52ac7028bec
- https://docs.kernel.org/networking/af_xdp.html
- https://github.com/torvalds/linux/commit/0a714186d3c0
- https://github.com/torvalds/linux/commit/8221c5eba8c1
- https://engineering.fb.com/2018/05/22/open-source/open-sourcing-katran-a-scalable-network-load-balancer/
- https://docs.kernel.org/bpf/map_lpm_trie.html
- https://docs.kernel.org/bpf/ringbuf.html
- https://docs.kernel.org/bpf/kfuncs.html
- https://nakryiko.com/posts/bpf-portability-and-co-re/
- https://docs.kernel.org/bpf/verifier.html
- https://github.com/torvalds/linux/commit/3f50f132d840
- https://link.springer.com/chapter/10.1007/978-3-031-37709-9_12
- https://github.com/torvalds/linux/commit/f1174f77b50c
- https://raw.githubusercontent.com/torvalds/linux/master/kernel/bpf/tnum.c
- https://arxiv.org/abs/2105.05398
- https://github.com/torvalds/linux/commit/256f0071f9b6
- https://github.com/torvalds/linux/commit/bbc631085503
- https://raw.githubusercontent.com/torvalds/linux/v7.3/include/linux/cnum.h
- https://raw.githubusercontent.com/torvalds/linux/v7.3/include/linux/bpf_verifier.h
- https://raw.githubusercontent.com/torvalds/linux/v7.4-rc1/include/linux/bpf_verifier.h
- https://nvd.nist.gov/vuln/detail/CVE-2020-8835
- https://nvd.nist.gov/vuln/detail/CVE-2021-3490
- https://nvd.nist.gov/vuln/detail/CVE-2021-31440
- https://nvd.nist.gov/vuln/detail/CVE-2022-23222
- https://nvd.nist.gov/vuln/detail/CVE-2023-2163
- https://vbpf.github.io/assets/prevail-paper.pdf
- https://github.com/torvalds/linux/commit/71b547f56124
- https://github.com/torvalds/linux/commit/c04c0d2b968a
- https://github.com/torvalds/linux/commit/9f3bcf081ded
- https://github.com/torvalds/linux/commit/9cfc28c9a8e6
- https://github.com/torvalds/linux/commit/2589726d12a1
- https://lwn.net/Articles/794934/
- https://github.com/torvalds/linux/commit/ab5cfac139ab
- https://github.com/torvalds/linux/commit/b2157399cc98
- https://docs.kernel.org/admin-guide/sysctl/kernel.html
- https://github.com/torvalds/linux/commit/8a03e56b253e
- https://lists.openwall.net/linux-kernel/2022/02/02/385
- https://dl.acm.org/doi/pdf/10.1145/3281411.3281443
- https://github.com/xdp-project/xdp-paper
- https://github.com/torvalds/linux/commit/75ccbef6369e
- https://github.com/torvalds/linux/commit/7e6897f95935
- https://docs.cilium.io/en/stable/network/kubernetes/kubeproxy-free/
- https://docs.cilium.io/en/stable/reference-guides/bpf/progtypes/
- https://janrueth.com/publication/2019-hohlfeld-bpfperf/2019-hohlfeld-bpfperf.pdf
- https://docs.cilium.io/en/stable/operations/performance/benchmark/
- https://www.youtube.com/watch?v=uYo2O3jbJLk
- https://www.kubernetes.dev/resources/keps/5343/
- https://docs.tigera.io/calico/latest/operations/ebpf/use-cases-ebpf
- https://docs.cilium.io/en/stable/operations/performance/tuning/
- https://github.com/libbpf/bpftool
- https://github.com/anakryiko/retsnoop
- https://docs.cilium.io/en/stable/observability/hubble/
- https://github.com/torvalds/linux/commit/e420bed025071a623d2720a92bc2245c84757ecb
- https://lwn.net/Articles/938632/
- https://raw.githubusercontent.com/xdp-project/xdp-tools/master/lib/libxdp/protocol.org
- https://docs.cilium.io/en/stable/operations/system_requirements/
- https://github.com/danobi/vmtest
- https://github.com/cilium/little-vm-helper
- https://docs.cilium.io/en/stable/security/network/proxy/envoy/
- https://docs.cilium.io/en/stable/operations/upgrade/
- https://docs.cilium.io/en/latest/operations/upgrade/
- https://docs.cilium.io/en/stable/network/servicemesh/mutual-authentication/mutual-authentication/
- https://docs.cilium.io/en/stable/security/network/encryption-ztunnel/
- https://istio.io/latest/blog/2024/ambient-reaches-ga/
- https://istio.io/latest/docs/ambient/architecture/data-plane/
- https://istio.io/latest/docs/ambient/architecture/traffic-redirection/
- https://istio.io/latest/docs/ambient/architecture/hbone/
- https://istio.io/latest/docs/ambient/usage/waypoint/
- https://blog.cloudflare.com/how-to-drop-10-million-packets/
- https://blog.cloudflare.com/l4drop-xdp-ebpf-based-ddos-mitigations/
- https://blog.cloudflare.com/unimog-cloudflares-edge-load-balancer/
- https://docs.cilium.io/en/latest/network/kubernetes/kubeproxy-free/
- https://docs.cilium.io/en/stable/network/servicemesh/
- https://github.com/bpftrace/bpftrace
- https://github.com/facebookincubator/katran
- https://github.com/kubernetes/kubernetes/pull/139067
- https://github.com/llvm/llvm-project/blob/main/llvm/lib/Target/BPF/BPFRegisterInfo.cpp
- https://github.com/torvalds/linux/blob/master/include/linux/bpf.h
- https://github.com/torvalds/linux/blob/master/include/linux/filter.h
- https://github.com/torvalds/linux/blob/master/kernel/bpf/Kconfig
- https://github.com/torvalds/linux/blob/master/kernel/bpf/verifier.c
- https://github.com/torvalds/linux/commit/049c4e13714e
- https://github.com/torvalds/linux/commit/08389d888287
- https://github.com/torvalds/linux/commit/10bf4e83167c
- https://github.com/torvalds/linux/commit/3bdd6d5ad5f8
- https://github.com/torvalds/linux/commit/457f44363a88
- https://github.com/torvalds/linux/commit/64620e0a1e71
- https://github.com/torvalds/linux/commit/69b693f0aefa
- https://github.com/torvalds/linux/commit/6a773a15a1e8
- https://github.com/torvalds/linux/commit/70ed506c3bbc
- https://github.com/torvalds/linux/commit/aa8d3a716b59
- https://github.com/torvalds/linux/commit/c0c77d8fb787
- https://github.com/torvalds/linux/commit/e6ac2450d6de
- https://github.com/torvalds/linux/commit/e6f2dd0f8067
- https://github.com/torvalds/linux/commit/f2d67fec0b43
- https://kernelnewbies.org/Linux_6.6
- https://man7.org/linux/man-pages/man7/bpf-helpers.7.html
- https://netflixtechblog.com/how-netflix-uses-ebpf-flow-logs-at-scale-for-network-insight-e3ea997dca96
- https://raw.githubusercontent.com/libbpf/bpftool/main/docs/bpftool-link.rst
- https://raw.githubusercontent.com/libbpf/bpftool/main/docs/bpftool-prog.rst
- https://raw.githubusercontent.com/torvalds/linux/v6.6/include/linux/bpf_verifier.h
- https://raw.githubusercontent.com/torvalds/linux/v6.6/kernel/bpf/verifier.c
- https://www.bizjournals.com/sanjose/news/2023/01/26/intel-halts-development-of-tofino-switch-chips.html
- https://raw.githubusercontent.com/torvalds/linux/master/include/linux/bpf.h